
 Yahoo Finance
 Sentiment Still Eluding Karoon Energy Ltd (ASX:KAR)
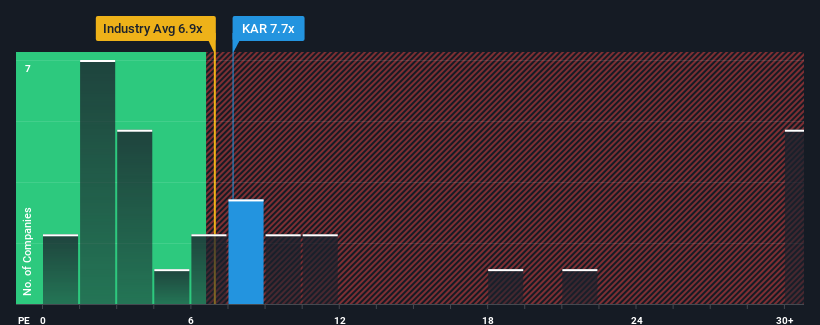
When close to half the companies in Australia have price-to-earnings ratios (or "P/E's") above 17x, you may consider Karoon Energy Ltd (ASX:KAR) as a highly attractive investment with its 7.7x P/E ratio. Nonetheless, we'd need to dig a little deeper to determine if there is a rational basis for the highly reduced P/E.
Karoon Energy could be doing better as it's been growing earnings less than most other companies lately. The P/E is probably low because investors think this lacklustre earnings performance isn't going to get any better. If this is the case, then existing shareholders will probably struggle to get excited about the future direction of the share price.
Check out our latest analysis for Karoon Energy
Keen to find out how analysts think Karoon Energy's future stacks up against the industry? In that case, our free report is a great place to start.
Is There Any Growth For Karoon Energy?
Karoon Energy's P/E ratio would be typical for a company that's expected to deliver very poor growth or even falling earnings, and importantly, perform much worse than the market.
If we review the last year of earnings, the company posted a result that saw barely any deviation from a year ago. That's essentially a continuation of what we've seen over the last three years, as its EPS growth has been virtually non-existent for that entire period. Therefore, it's fair to say that earnings growth has definitely eluded the company recently.
Turning to the outlook, the next three years should generate growth of 22% per year as estimated by the eight analysts watching the company. Meanwhile, the rest of the market is forecast to only expand by 13% each year, which is noticeably less attractive.
With this information, we find it odd that Karoon Energy is trading at a P/E lower than the market. Apparently some shareholders are doubtful of the forecasts and have been accepting significantly lower selling prices.
The Key Takeaway
Using the price-to-earnings ratio alone to determine if you should sell your stock isn't sensible, however it can be a practical guide to the company's future prospects.
We've established that Karoon Energy currently trades on a much lower than expected P/E since its forecast growth is higher than the wider market. When we see a strong earnings outlook with faster-than-market growth, we assume potential risks are what might be placing significant pressure on the P/E ratio. At least price risks look to be very low, but investors seem to think future earnings could see a lot of volatility.
We don't want to rain on the parade too much, but we did also find 1 warning sign for Karoon Energy that you need to be mindful of.
If you're unsure about the strength of Karoon Energy's business, why not explore our interactive list of stocks with solid business fundamentals for some other companies you may have missed.
Have feedback on this article? Concerned about the content? Get in touch with us directly. Alternatively, email editorial-team (at) simplywallst.com.
This article by Simply Wall St is general in nature. We provide commentary based on historical data and analyst forecasts only using an unbiased methodology and our articles are not intended to be financial advice. It does not constitute a recommendation to buy or sell any stock, and does not take account of your objectives, or your financial situation. We aim to bring you long-term focused analysis driven by fundamental data. Note that our analysis may not factor in the latest price-sensitive company announcements or qualitative material. Simply Wall St has no position in any stocks mentioned.
Join A Paid User Research Session
You’ll receive a US$30 Amazon Gift card for 1 hour of your time while helping us build better investing tools for the individual investors like yourself. Sign up here
