
 Yahoo Finance
 Seagen (NASDAQ:SGEN) shareholders have earned a 29% CAGR over the last five years
The most you can lose on any stock (assuming you don't use leverage) is 100% of your money. But when you pick a company that is really flourishing, you can make more than 100%. One great example is Seagen Inc. (NASDAQ:SGEN) which saw its share price drive 260% higher over five years. Also pleasing for shareholders was the 42% gain in the last three months. This could be related to the recent financial results, released recently - you can catch up on the most recent data by reading our company report.
With that in mind, it's worth seeing if the company's underlying fundamentals have been the driver of long term performance, or if there are some discrepancies.
Check out our latest analysis for Seagen
Seagen wasn't profitable in the last twelve months, it is unlikely we'll see a strong correlation between its share price and its earnings per share (EPS). Arguably revenue is our next best option. When a company doesn't make profits, we'd generally expect to see good revenue growth. That's because it's hard to be confident a company will be sustainable if revenue growth is negligible, and it never makes a profit.
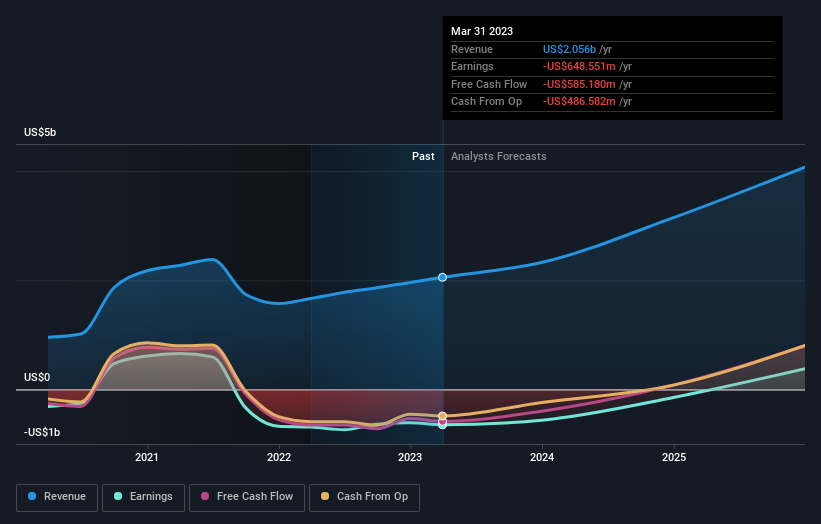
For the last half decade, Seagen can boast revenue growth at a rate of 26% per year. Even measured against other revenue-focussed companies, that's a good result. So it's not entirely surprising that the share price reflected this performance by increasing at a rate of 29% per year, in that time. This suggests the market has well and truly recognized the progress the business has made. Seagen seems like a high growth stock - so growth investors might want to add it to their watchlist.
The graphic below depicts how earnings and revenue have changed over time (unveil the exact values by clicking on the image).
Seagen is a well known stock, with plenty of analyst coverage, suggesting some visibility into future growth. You can see what analysts are predicting for Seagen in this interactive graph of future profit estimates.
A Different Perspective
We're pleased to report that Seagen shareholders have received a total shareholder return of 40% over one year. Since the one-year TSR is better than the five-year TSR (the latter coming in at 29% per year), it would seem that the stock's performance has improved in recent times. Given the share price momentum remains strong, it might be worth taking a closer look at the stock, lest you miss an opportunity. Most investors take the time to check the data on insider transactions. You can click here to see if insiders have been buying or selling.
If you like to buy stocks alongside management, then you might just love this free list of companies. (Hint: insiders have been buying them).
Please note, the market returns quoted in this article reflect the market weighted average returns of stocks that currently trade on American exchanges.
Have feedback on this article? Concerned about the content? Get in touch with us directly. Alternatively, email editorial-team (at) simplywallst.com.
This article by Simply Wall St is general in nature. We provide commentary based on historical data and analyst forecasts only using an unbiased methodology and our articles are not intended to be financial advice. It does not constitute a recommendation to buy or sell any stock, and does not take account of your objectives, or your financial situation. We aim to bring you long-term focused analysis driven by fundamental data. Note that our analysis may not factor in the latest price-sensitive company announcements or qualitative material. Simply Wall St has no position in any stocks mentioned.
Join A Paid User Research Session
You’ll receive a US$30 Amazon Gift card for 1 hour of your time while helping us build better investing tools for the individual investors like yourself. Sign up here
