
 Yahoo Finance
 Seagen Inc.'s (NASDAQ:SGEN) Business Is Trailing The Industry But Its Shares Aren't
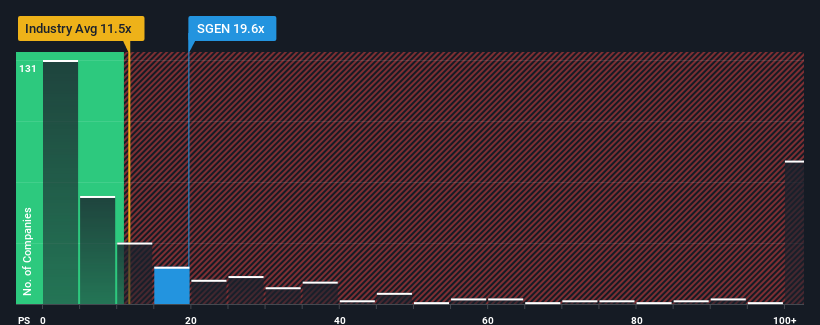
You may think that with a price-to-sales (or "P/S") ratio of 19.6x Seagen Inc. (NASDAQ:SGEN) is a stock to avoid completely, seeing as almost half of all the Biotechs companies in the United States have P/S ratios under 11.5x and even P/S lower than 3x aren't out of the ordinary. Although, it's not wise to just take the P/S at face value as there may be an explanation why it's so lofty.
View our latest analysis for Seagen
What Does Seagen's P/S Mean For Shareholders?
With revenue growth that's inferior to most other companies of late, Seagen has been relatively sluggish. One possibility is that the P/S ratio is high because investors think this lacklustre revenue performance will improve markedly. You'd really hope so, otherwise you're paying a pretty hefty price for no particular reason.
If you'd like to see what analysts are forecasting going forward, you should check out our free report on Seagen.
Do Revenue Forecasts Match The High P/S Ratio?
In order to justify its P/S ratio, Seagen would need to produce outstanding growth that's well in excess of the industry.
Taking a look back first, we see that the company grew revenue by an impressive 25% last year. The strong recent performance means it was also able to grow revenue by 114% in total over the last three years. Therefore, it's fair to say the revenue growth recently has been superb for the company.
Turning to the outlook, the next three years should generate growth of 28% each year as estimated by the analysts watching the company. That's shaping up to be materially lower than the 92% per annum growth forecast for the broader industry.
With this information, we find it concerning that Seagen is trading at a P/S higher than the industry. It seems most investors are hoping for a turnaround in the company's business prospects, but the analyst cohort is not so confident this will happen. Only the boldest would assume these prices are sustainable as this level of revenue growth is likely to weigh heavily on the share price eventually.
The Final Word
Using the price-to-sales ratio alone to determine if you should sell your stock isn't sensible, however it can be a practical guide to the company's future prospects.
It comes as a surprise to see Seagen trade at such a high P/S given the revenue forecasts look less than stellar. Right now we aren't comfortable with the high P/S as the predicted future revenues aren't likely to support such positive sentiment for long. This places shareholders' investments at significant risk and potential investors in danger of paying an excessive premium.
A lot of potential risks can sit within a company's balance sheet. Take a look at our free balance sheet analysis for Seagen with six simple checks on some of these key factors.
If these risks are making you reconsider your opinion on Seagen, explore our interactive list of high quality stocks to get an idea of what else is out there.
Have feedback on this article? Concerned about the content? Get in touch with us directly. Alternatively, email editorial-team (at) simplywallst.com.
This article by Simply Wall St is general in nature. We provide commentary based on historical data and analyst forecasts only using an unbiased methodology and our articles are not intended to be financial advice. It does not constitute a recommendation to buy or sell any stock, and does not take account of your objectives, or your financial situation. We aim to bring you long-term focused analysis driven by fundamental data. Note that our analysis may not factor in the latest price-sensitive company announcements or qualitative material. Simply Wall St has no position in any stocks mentioned.
Join A Paid User Research Session
You’ll receive a US$30 Amazon Gift card for 1 hour of your time while helping us build better investing tools for the individual investors like yourself. Sign up here
