
 Yahoo Finance
 Sampo Oyj's Dividend Analysis
Assessing the Sustainability of Sampo Oyj's Upcoming Dividend
Sampo Oyj (SAXPY) recently announced a dividend of $0.97 per share, payable on 2024-05-22, with the ex-dividend date set for 2024-04-26. As investors look forward to this upcoming payment, the spotlight also shines on the company's dividend history, yield, and growth rates. Using the data from GuruFocus, let's look into Sampo Oyj's dividend performance and assess its sustainability.
What Does Sampo Oyj Do?
This Powerful Chart Made Peter Lynch 29% A Year For 13 Years
How to calculate the intrinsic value of a stock?
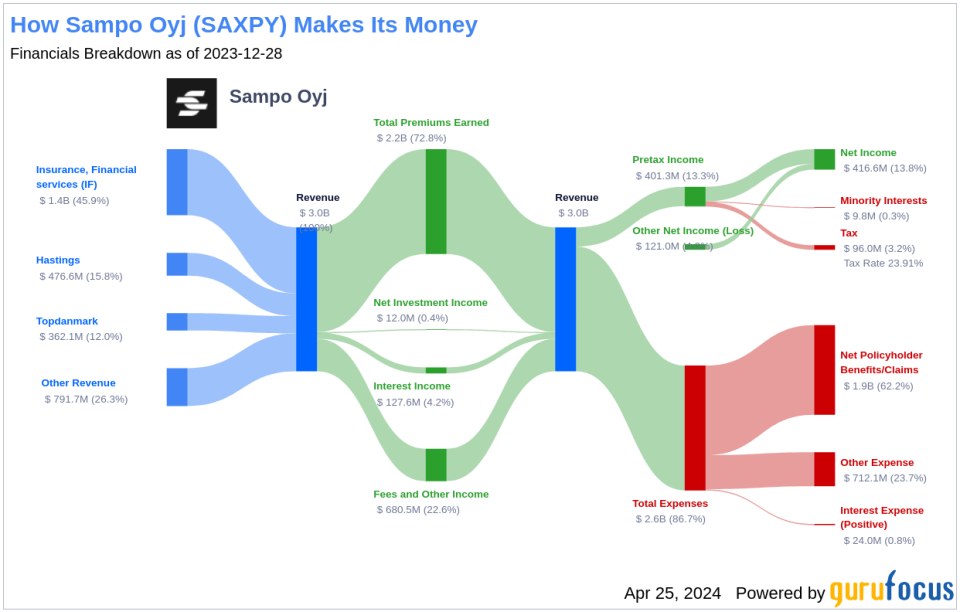
Sampo Oyj is a leading Nordics-based insurer headquartered in Finland and listed in Helsinki. The company has operations in Denmark, Estonia, Finland, Norway, Lithuania, Latvia, and the United Kingdom. Sampo has four subsidiaries that mainly sell personal lines of insurance to retail customers. It is the largest property and casualty insurer in the Nordics. Headquartered in Sweden, If also sells insurance in Denmark, Norway, and Finland. Topdanmark is a Danish property and casualty insurer also focusing on personal lines insurance as well as agriculture and small and medium-sized enterprises. Hastings is a digital insurer that focuses on car, van, bike, and home insurance in the U.K.
A Glimpse at Sampo Oyj's Dividend History
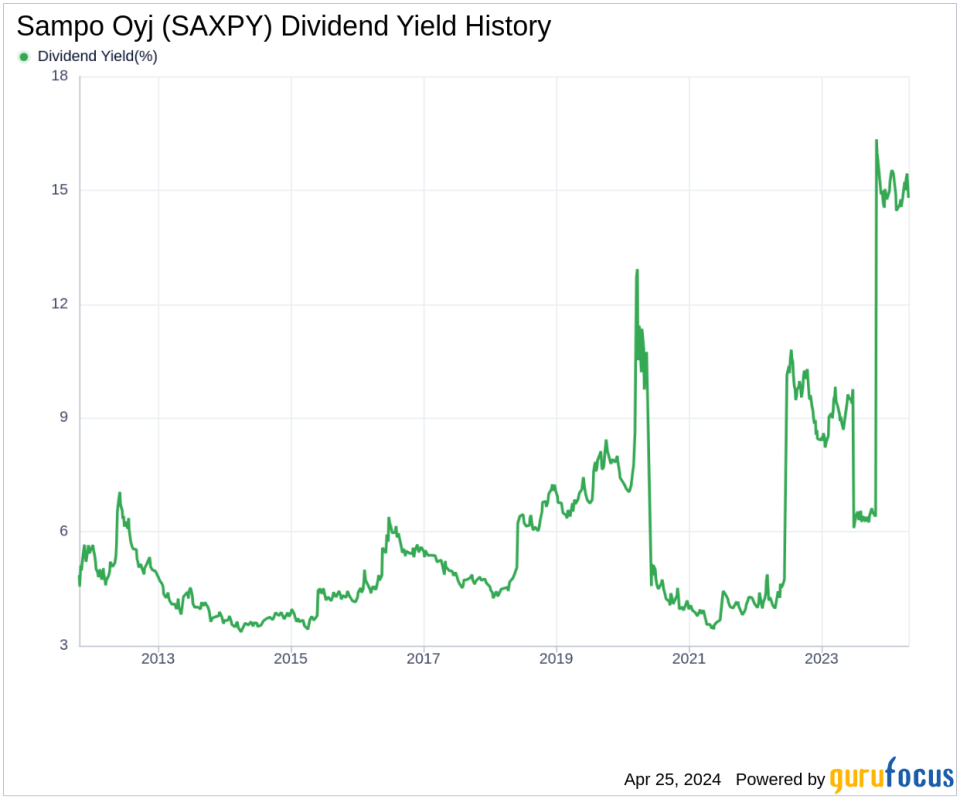
Sampo Oyj has maintained a consistent dividend payment record since 2009. Dividends are currently distributed on a bi-annual basis. Below is a chart showing annual Dividends Per Share for tracking historical trends.
Breaking Down Sampo Oyj's Dividend Yield and Growth
As of today, Sampo Oyj currently has a 12-month trailing dividend yield of 14.94% and a 12-month forward dividend yield of 19.38%. This suggests an expectation of increased dividend payments over the next 12 months.
Over the past three years, Sampo Oyj's annual dividend growth rate was 6.30%. Extended to a five-year horizon, this rate decreased to -7.20% per year. And over the past decade, Sampo Oyj's annual dividends per share growth rate stands at 1.40%.
Based on Sampo Oyj's dividend yield and five-year growth rate, the 5-year yield on cost of Sampo Oyj stock as of today is approximately 10.28%.
The Sustainability Question: Payout Ratio and Profitability
To assess the sustainability of the dividend, one needs to evaluate the company's payout ratio. The dividend payout ratio provides insights into the portion of earnings the company distributes as dividends. A lower ratio suggests that the company retains a significant part of its earnings, thereby ensuring the availability of funds for future growth and unexpected downturns. As of 2023-12-31, Sampo Oyj's dividend payout ratio is 2.88, which may suggest that the company's dividend may not be sustainable.
Sampo Oyj's profitability rank, offers an understanding of the company's earnings prowess relative to its peers. GuruFocus ranks Sampo Oyj's profitability 6 out of 10 as of 2023-12-31, suggesting fair profitability. The company has reported positive net income for each year over the past decade, further solidifying its high profitability.
Growth Metrics: The Future Outlook
To ensure the sustainability of dividends, a company must have robust growth metrics. Sampo Oyj's growth rank of 6 out of 10 suggests that the company has a fair growth outlook.
Revenue is the lifeblood of any company, and Sampo Oyj's revenue per share, combined with the 3-year revenue growth rate, indicates a strong revenue model. Sampo Oyj's revenue has increased by approximately 4.40% per year on average, a rate that underperforms approximately 56.99% of global competitors.
The company's 3-year EPS growth rate showcases its capability to grow its earnings, a critical component for sustaining dividends in the long run. During the past three years, Sampo Oyj's earnings increased by approximately 6.70% per year on average, a rate that underperforms approximately 54.55% of global competitors.
Lastly, the company's 5-year EBITDA growth rate of -1.40%, which underperforms approximately 70.47% of global competitors.
Next Steps
In conclusion, while Sampo Oyj's dividend payment is anticipated with optimism, a deeper look raises questions about its sustainability. The company's consistent dividend history provides a level of reassurance, yet the payout ratio and growth metrics present a mixed picture. Investors should consider the balance between Sampo Oyj's dividend growth rate, payout ratio, profitability, and growth metrics when evaluating its future prospects. As always, robust due diligence is recommended before making any investment decisions. Will Sampo Oyj continue to be a reliable source of dividends for investors, or will the challenging growth metrics necessitate a reevaluation of its dividend policy? GuruFocus Premium users can screen for high-dividend yield stocks using the High Dividend Yield Screener to explore additional investment opportunities.
This article, generated by GuruFocus, is designed to provide general insights and is not tailored financial advice. Our commentary is rooted in historical data and analyst projections, utilizing an impartial methodology, and is not intended to serve as specific investment guidance. It does not formulate a recommendation to purchase or divest any stock and does not consider individual investment objectives or financial circumstances. Our objective is to deliver long-term, fundamental data-driven analysis. Be aware that our analysis might not incorporate the most recent, price-sensitive company announcements or qualitative information. GuruFocus holds no position in the stocks mentioned herein.
This article first appeared on GuruFocus.
