
 Yahoo Finance
 Salem Media Group (NASDAQ:SALM) shareholders have earned a 188% return over the last year
Unless you borrow money to invest, the potential losses are limited. But if you pick the right business to buy shares in, you can make more than you can lose. Take, for example Salem Media Group, Inc. (NASDAQ:SALM). Its share price is already up an impressive 188% in the last twelve months. In more good news, the share price has risen 15% in thirty days. On the other hand, longer term shareholders have had a tougher run, with the stock falling 32% in three years.
With that in mind, it's worth seeing if the company's underlying fundamentals have been the driver of long term performance, or if there are some discrepancies.
View our latest analysis for Salem Media Group
To paraphrase Benjamin Graham: Over the short term the market is a voting machine, but over the long term it's a weighing machine. One flawed but reasonable way to assess how sentiment around a company has changed is to compare the earnings per share (EPS) with the share price.
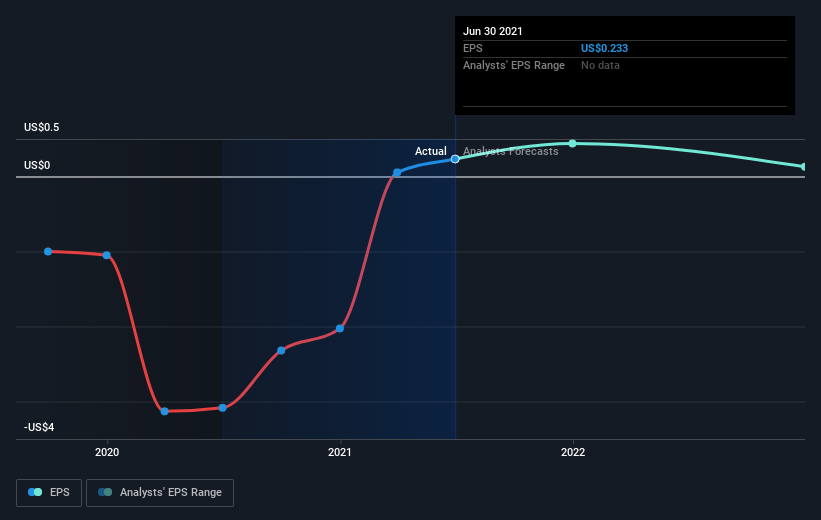
Salem Media Group went from making a loss to reporting a profit, in the last year.
We think the growth looks very prospective, so we're not surprised the market liked it too. Generally speaking the profitability inflection point is a great time to research a company closely, lest you miss an opportunity to profit.
You can see how EPS has changed over time in the image below (click on the chart to see the exact values).
We know that Salem Media Group has improved its bottom line lately, but is it going to grow revenue? Check if analysts think Salem Media Group will grow revenue in the future.
A Different Perspective
It's good to see that Salem Media Group has rewarded shareholders with a total shareholder return of 188% in the last twelve months. There's no doubt those recent returns are much better than the TSR loss of 8% per year over five years. We generally put more weight on the long term performance over the short term, but the recent improvement could hint at a (positive) inflection point within the business. I find it very interesting to look at share price over the long term as a proxy for business performance. But to truly gain insight, we need to consider other information, too. Consider for instance, the ever-present spectre of investment risk. We've identified 5 warning signs with Salem Media Group (at least 2 which are a bit concerning) , and understanding them should be part of your investment process.
We will like Salem Media Group better if we see some big insider buys. While we wait, check out this free list of growing companies with considerable, recent, insider buying.
Please note, the market returns quoted in this article reflect the market weighted average returns of stocks that currently trade on US exchanges.
This article by Simply Wall St is general in nature. We provide commentary based on historical data and analyst forecasts only using an unbiased methodology and our articles are not intended to be financial advice. It does not constitute a recommendation to buy or sell any stock, and does not take account of your objectives, or your financial situation. We aim to bring you long-term focused analysis driven by fundamental data. Note that our analysis may not factor in the latest price-sensitive company announcements or qualitative material. Simply Wall St has no position in any stocks mentioned.
Have feedback on this article? Concerned about the content? Get in touch with us directly. Alternatively, email editorial-team (at) simplywallst.com.
