
 Yahoo Finance
 Do You Like Roots Corporation (TSE:ROOT) At This P/E Ratio?

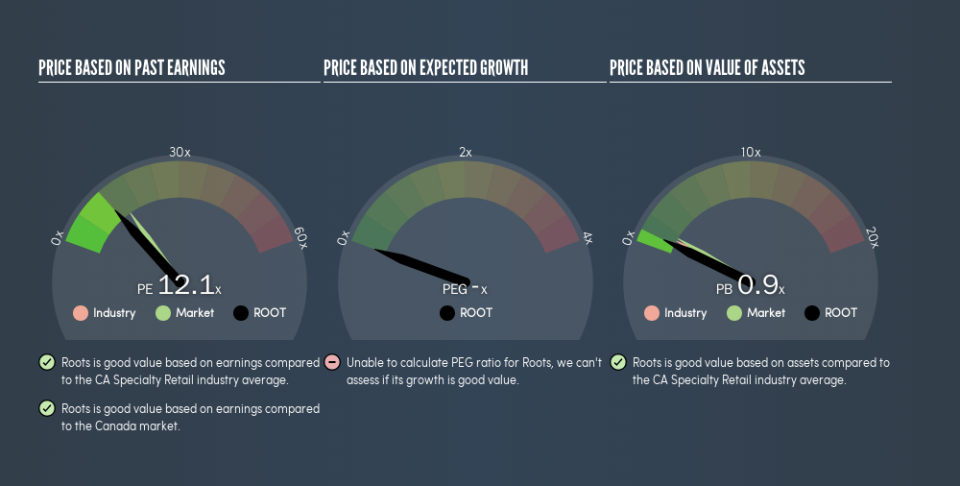
The goal of this article is to teach you how to use price to earnings ratios (P/E ratios). To keep it practical, we’ll show how Roots Corporation’s (TSE:ROOT) P/E ratio could help you assess the value on offer. Roots has a P/E ratio of 12.11, based on the last twelve months. That means that at current prices, buyers pay CA$12.11 for every CA$1 in trailing yearly profits.
View our latest analysis for Roots
How Do I Calculate A Price To Earnings Ratio?
The formula for price to earnings is:
Price to Earnings Ratio = Share Price ÷ Earnings per Share (EPS)
Or for Roots:
P/E of 12.11 = CA$4.03 ÷ CA$0.33 (Based on the trailing twelve months to November 2018.)
Is A High Price-to-Earnings Ratio Good?
A higher P/E ratio implies that investors pay a higher price for the earning power of the business. That is not a good or a bad thing per se, but a high P/E does imply buyers are optimistic about the future.
How Growth Rates Impact P/E Ratios
When earnings fall, the ‘E’ decreases, over time. That means even if the current P/E is low, it will increase over time if the share price stays flat. So while a stock may look cheap based on past earnings, it could be expensive based on future earnings.
Roots had pretty flat EPS growth in the last year. And over the longer term (3 years) earnings per share have decreased 7.1% annually. So you wouldn’t expect a very high P/E.
How Does Roots’s P/E Ratio Compare To Its Peers?
We can get an indication of market expectations by looking at the P/E ratio. As you can see below Roots has a P/E ratio that is fairly close for the average for the specialty retail industry, which is 12.6.
Its P/E ratio suggests that Roots shareholders think that in the future it will perform about the same as other companies in its industry classification. The company could surprise by performing better than average, in the future. Further research into factors such asmanagement tenure, could help you form your own view on whether that is likely.
Don’t Forget: The P/E Does Not Account For Debt or Bank Deposits
The ‘Price’ in P/E reflects the market capitalization of the company. In other words, it does not consider any debt or cash that the company may have on the balance sheet. Theoretically, a business can improve its earnings (and produce a lower P/E in the future), by taking on debt (or spending its remaining cash).
Such spending might be good or bad, overall, but the key point here is that you need to look at debt to understand the P/E ratio in context.
Is Debt Impacting Roots’s P/E?
Net debt totals 79% of Roots’s market cap. This is a reasonably significant level of debt — all else being equal you’d expect a much lower P/E than if it had net cash.
The Bottom Line On Roots’s P/E Ratio
Roots’s P/E is 12.1 which is below average (14.8) in the CA market. Given meaningful debt, and a lack of recent growth, the market looks to be extrapolating this recent performance; reflecting low expectations for the future.
Investors have an opportunity when market expectations about a stock are wrong. If it is underestimating a company, investors can make money by buying and holding the shares until the market corrects itself. So this free visualization of the analyst consensus on future earnings could help you make the right decision about whether to buy, sell, or hold.
Of course you might be able to find a better stock than Roots. So you may wish to see this free collection of other companies that have grown earnings strongly.
We aim to bring you long-term focused research analysis driven by fundamental data. Note that our analysis may not factor in the latest price-sensitive company announcements or qualitative material.
If you spot an error that warrants correction, please contact the editor at editorial-team@simplywallst.com. This article by Simply Wall St is general in nature. It does not constitute a recommendation to buy or sell any stock, and does not take account of your objectives, or your financial situation. Simply Wall St has no position in the stocks mentioned. Thank you for reading.
