
 Yahoo Finance
 RMA Global (ASX:RMY) investors are sitting on a loss of 33% if they invested a year ago
Passive investing in an index fund is a good way to ensure your own returns roughly match the overall market. But if you buy individual stocks, you can do both better or worse than that. Investors in RMA Global Limited (ASX:RMY) have tasted that bitter downside in the last year, as the share price dropped 33%. That's disappointing when you consider the market returned 12%. Longer term shareholders haven't suffered as badly, since the stock is down a comparatively less painful 15% in three years. Shareholders have had an even rougher run lately, with the share price down 29% in the last 90 days.
Since shareholders are down over the longer term, lets look at the underlying fundamentals over the that time and see if they've been consistent with returns.
Check out our latest analysis for RMA Global
RMA Global wasn't profitable in the last twelve months, it is unlikely we'll see a strong correlation between its share price and its earnings per share (EPS). Arguably revenue is our next best option. When a company doesn't make profits, we'd generally expect to see good revenue growth. As you can imagine, fast revenue growth, when maintained, often leads to fast profit growth.
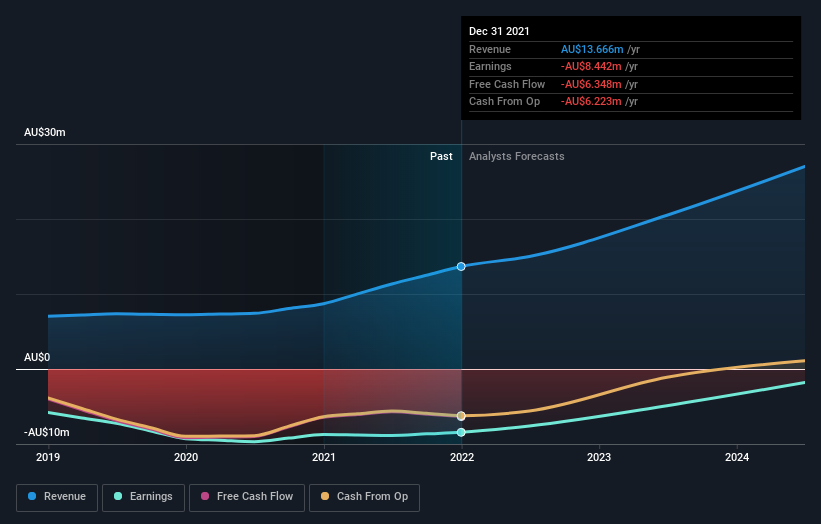
RMA Global grew its revenue by 57% over the last year. That's well above most other pre-profit companies. The share price drop of 33% over twelve months would be considered disappointing by many, so you might argue the company is getting little credit for its impressive revenue growth. On the bright side, if this company is moving profits in the right direction, top-line growth like that could be an opportunity. Our monkey brains haven't evolved to think exponentially, so humans do tend to underestimate companies that have exponential growth.
The image below shows how earnings and revenue have tracked over time (if you click on the image you can see greater detail).
It's probably worth noting we've seen significant insider buying in the last quarter, which we consider a positive. That said, we think earnings and revenue growth trends are even more important factors to consider. You can see what analysts are predicting for RMA Global in this interactive graph of future profit estimates.
A Different Perspective
The last twelve months weren't great for RMA Global shares, which cost holders 33%, while the market was up about 12%. However, keep in mind that even the best stocks will sometimes underperform the market over a twelve month period. The three-year loss of 5% per year isn't as bad as the last twelve months, suggesting that the company has not been able to convince the market it has solved its problems. We would be wary of buying into a company with unsolved problems, although some investors will buy into struggling stocks if they believe the price is sufficiently attractive. It's always interesting to track share price performance over the longer term. But to understand RMA Global better, we need to consider many other factors. For example, we've discovered 3 warning signs for RMA Global that you should be aware of before investing here.
If you like to buy stocks alongside management, then you might just love this free list of companies. (Hint: insiders have been buying them).
Please note, the market returns quoted in this article reflect the market weighted average returns of stocks that currently trade on AU exchanges.
Have feedback on this article? Concerned about the content? Get in touch with us directly. Alternatively, email editorial-team (at) simplywallst.com.
This article by Simply Wall St is general in nature. We provide commentary based on historical data and analyst forecasts only using an unbiased methodology and our articles are not intended to be financial advice. It does not constitute a recommendation to buy or sell any stock, and does not take account of your objectives, or your financial situation. We aim to bring you long-term focused analysis driven by fundamental data. Note that our analysis may not factor in the latest price-sensitive company announcements or qualitative material. Simply Wall St has no position in any stocks mentioned.
