
 Yahoo Finance
 A Rising Share Price Has Us Looking Closely At National Beverage Corp.'s (NASDAQ:FIZZ) P/E Ratio

National Beverage (NASDAQ:FIZZ) shares have had a really impressive month, gaining 32%, after some slippage. But that gain wasn't enough to make shareholders whole, as the share price is still down 2.8% in the last year.
Assuming no other changes, a sharply higher share price makes a stock less attractive to potential buyers. While the market sentiment towards a stock is very changeable, in the long run, the share price will tend to move in the same direction as earnings per share. The implication here is that deep value investors might steer clear when expectations of a company are too high. Perhaps the simplest way to get a read on investors' expectations of a business is to look at its Price to Earnings Ratio (PE Ratio). A high P/E ratio means that investors have a high expectation about future growth, while a low P/E ratio means they have low expectations about future growth.
Check out our latest analysis for National Beverage
How Does National Beverage's P/E Ratio Compare To Its Peers?
National Beverage's P/E of 20.33 indicates relatively low sentiment towards the stock. We can see in the image below that the average P/E (28.7) for companies in the beverage industry is higher than National Beverage's P/E.
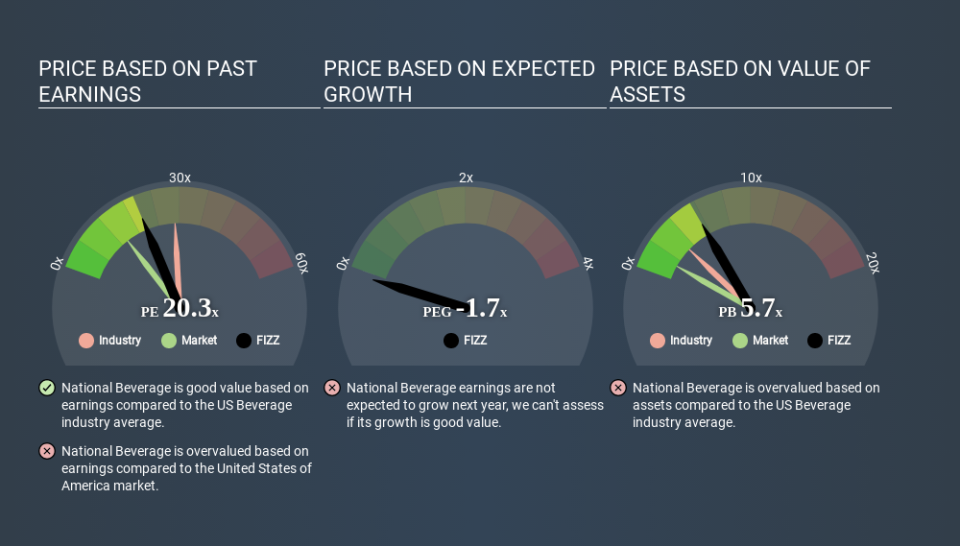
This suggests that market participants think National Beverage will underperform other companies in its industry. Since the market seems unimpressed with National Beverage, it's quite possible it could surprise on the upside. It is arguably worth checking if insiders are buying shares, because that might imply they believe the stock is undervalued.
How Growth Rates Impact P/E Ratios
Probably the most important factor in determining what P/E a company trades on is the earnings growth. Earnings growth means that in the future the 'E' will be higher. Therefore, even if you pay a high multiple of earnings now, that multiple will become lower in the future. Then, a lower P/E should attract more buyers, pushing the share price up.
National Beverage shrunk earnings per share by 21% over the last year. But it has grown its earnings per share by 20% per year over the last five years.
Remember: P/E Ratios Don't Consider The Balance Sheet
One drawback of using a P/E ratio is that it considers market capitalization, but not the balance sheet. That means it doesn't take debt or cash into account. Theoretically, a business can improve its earnings (and produce a lower P/E in the future) by investing in growth. That means taking on debt (or spending its cash).
Spending on growth might be good or bad a few years later, but the point is that the P/E ratio does not account for the option (or lack thereof).
So What Does National Beverage's Balance Sheet Tell Us?
National Beverage has net cash of US$262m. This is fairly high at 11% of its market capitalization. That might mean balance sheet strength is important to the business, but should also help push the P/E a bit higher than it would otherwise be.
The Verdict On National Beverage's P/E Ratio
National Beverage's P/E is 20.3 which is above average (13.7) in its market. The recent drop in earnings per share would make some investors cautious, but the healthy balance sheet means the company retains the potential for future growth. If this growth fails to materialise, the current high P/E could prove to be temporary, as the share price falls. What is very clear is that the market has become more optimistic about National Beverage over the last month, with the P/E ratio rising from 15.4 back then to 20.3 today. For those who prefer to invest with the flow of momentum, that might mean it's time to put the stock on a watchlist, or research it. But the contrarian may see it as a missed opportunity.
Investors have an opportunity when market expectations about a stock are wrong. If the reality for a company is better than it expects, you can make money by buying and holding for the long term. So this free visual report on analyst forecasts could hold the key to an excellent investment decision.
You might be able to find a better buy than National Beverage. If you want a selection of possible winners, check out this free list of interesting companies that trade on a P/E below 20 (but have proven they can grow earnings).
If you spot an error that warrants correction, please contact the editor at editorial-team@simplywallst.com. This article by Simply Wall St is general in nature. It does not constitute a recommendation to buy or sell any stock, and does not take account of your objectives, or your financial situation. Simply Wall St has no position in the stocks mentioned.
We aim to bring you long-term focused research analysis driven by fundamental data. Note that our analysis may not factor in the latest price-sensitive company announcements or qualitative material. Thank you for reading.
