
 Yahoo Finance
 Revenues Working Against Carbonxt Group Limited's (ASX:CG1) Share Price
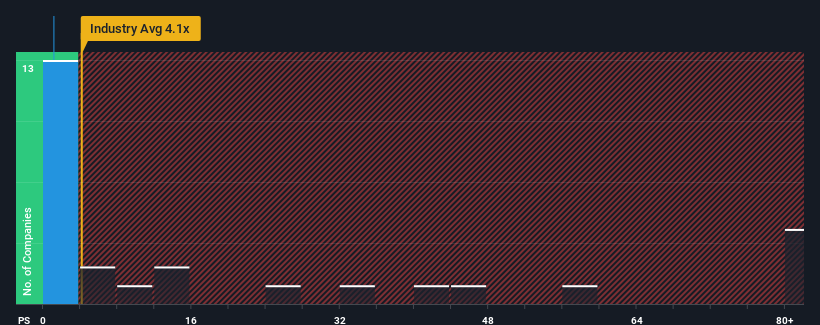
You may think that with a price-to-sales (or "P/S") ratio of 1.1x Carbonxt Group Limited (ASX:CG1) is definitely a stock worth checking out, seeing as almost half of all the Chemicals companies in Australia have P/S ratios greater than 4.1x and even P/S above 42x aren't out of the ordinary. However, the P/S might be quite low for a reason and it requires further investigation to determine if it's justified.
Check out our latest analysis for Carbonxt Group
How Carbonxt Group Has Been Performing
As an illustration, revenue has deteriorated at Carbonxt Group over the last year, which is not ideal at all. One possibility is that the P/S is low because investors think the company won't do enough to avoid underperforming the broader industry in the near future. However, if this doesn't eventuate then existing shareholders may be feeling optimistic about the future direction of the share price.
Although there are no analyst estimates available for Carbonxt Group, take a look at this free data-rich visualisation to see how the company stacks up on earnings, revenue and cash flow.
Do Revenue Forecasts Match The Low P/S Ratio?
The only time you'd be truly comfortable seeing a P/S as depressed as Carbonxt Group's is when the company's growth is on track to lag the industry decidedly.
Taking a look back first, the company's revenue growth last year wasn't something to get excited about as it posted a disappointing decline of 16%. This means it has also seen a slide in revenue over the longer-term as revenue is down 2.1% in total over the last three years. Accordingly, shareholders would have felt downbeat about the medium-term rates of revenue growth.
Weighing that medium-term revenue trajectory against the broader industry's one-year forecast for expansion of 5,353% shows it's an unpleasant look.
With this information, we are not surprised that Carbonxt Group is trading at a P/S lower than the industry. However, we think shrinking revenues are unlikely to lead to a stable P/S over the longer term, which could set up shareholders for future disappointment. There's potential for the P/S to fall to even lower levels if the company doesn't improve its top-line growth.
What We Can Learn From Carbonxt Group's P/S?
While the price-to-sales ratio shouldn't be the defining factor in whether you buy a stock or not, it's quite a capable barometer of revenue expectations.
It's no surprise that Carbonxt Group maintains its low P/S off the back of its sliding revenue over the medium-term. Right now shareholders are accepting the low P/S as they concede future revenue probably won't provide any pleasant surprises either. Unless the recent medium-term conditions improve, they will continue to form a barrier for the share price around these levels.
You should always think about risks. Case in point, we've spotted 1 warning sign for Carbonxt Group you should be aware of.
It's important to make sure you look for a great company, not just the first idea you come across. So if growing profitability aligns with your idea of a great company, take a peek at this free list of interesting companies with strong recent earnings growth (and a low P/E).
Have feedback on this article? Concerned about the content? Get in touch with us directly. Alternatively, email editorial-team (at) simplywallst.com.
This article by Simply Wall St is general in nature. We provide commentary based on historical data and analyst forecasts only using an unbiased methodology and our articles are not intended to be financial advice. It does not constitute a recommendation to buy or sell any stock, and does not take account of your objectives, or your financial situation. We aim to bring you long-term focused analysis driven by fundamental data. Note that our analysis may not factor in the latest price-sensitive company announcements or qualitative material. Simply Wall St has no position in any stocks mentioned.
