
 Yahoo Finance
 Revenues Working Against Boart Longyear Group Ltd.'s (ASX:BLY) Share Price
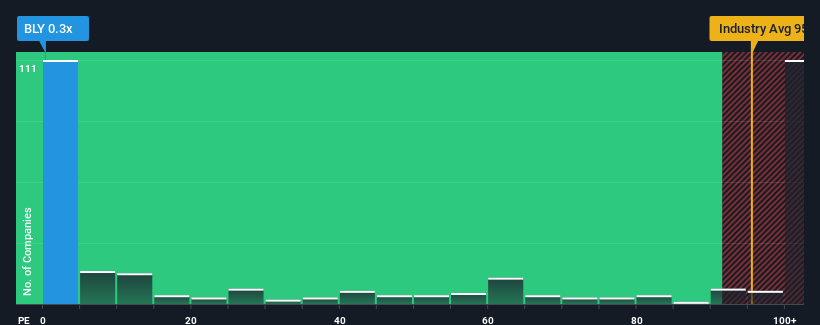
Boart Longyear Group Ltd.'s (ASX:BLY) price-to-sales (or "P/S") ratio of 0.3x might make it look like a strong buy right now compared to the Metals and Mining industry in Australia, where around half of the companies have P/S ratios above 95.4x and even P/S above 584x are quite common. Nonetheless, we'd need to dig a little deeper to determine if there is a rational basis for the highly reduced P/S.
See our latest analysis for Boart Longyear Group
How Has Boart Longyear Group Performed Recently?
Boart Longyear Group has been doing a decent job lately as it's been growing revenue at a reasonable pace. One possibility is that the P/S ratio is low because investors think this good revenue growth might actually underperform the broader industry in the near future. If you like the company, you'd be hoping this isn't the case so that you could potentially pick up some stock while it's out of favour.
We don't have analyst forecasts, but you can see how recent trends are setting up the company for the future by checking out our free report on Boart Longyear Group's earnings, revenue and cash flow.
How Is Boart Longyear Group's Revenue Growth Trending?
Boart Longyear Group's P/S ratio would be typical for a company that's expected to deliver very poor growth or even falling revenue, and importantly, perform much worse than the industry.
If we review the last year of revenue growth, the company posted a worthy increase of 5.5%. This was backed up an excellent period prior to see revenue up by 59% in total over the last three years. So we can start by confirming that the company has done a great job of growing revenues over that time.
Comparing that to the industry, which is predicted to deliver 51% growth in the next 12 months, the company's momentum is weaker, based on recent medium-term annualised revenue results.
With this information, we can see why Boart Longyear Group is trading at a P/S lower than the industry. It seems most investors are expecting to see the recent limited growth rates continue into the future and are only willing to pay a reduced amount for the stock.
The Key Takeaway
Generally, our preference is to limit the use of the price-to-sales ratio to establishing what the market thinks about the overall health of a company.
In line with expectations, Boart Longyear Group maintains its low P/S on the weakness of its recent three-year growth being lower than the wider industry forecast. Right now shareholders are accepting the low P/S as they concede future revenue probably won't provide any pleasant surprises. If recent medium-term revenue trends continue, it's hard to see the share price experience a reversal of fortunes anytime soon.
Before you settle on your opinion, we've discovered 1 warning sign for Boart Longyear Group that you should be aware of.
If these risks are making you reconsider your opinion on Boart Longyear Group, explore our interactive list of high quality stocks to get an idea of what else is out there.
Have feedback on this article? Concerned about the content? Get in touch with us directly. Alternatively, email editorial-team (at) simplywallst.com.
This article by Simply Wall St is general in nature. We provide commentary based on historical data and analyst forecasts only using an unbiased methodology and our articles are not intended to be financial advice. It does not constitute a recommendation to buy or sell any stock, and does not take account of your objectives, or your financial situation. We aim to bring you long-term focused analysis driven by fundamental data. Note that our analysis may not factor in the latest price-sensitive company announcements or qualitative material. Simply Wall St has no position in any stocks mentioned.
