
 Yahoo Finance
 Revenues Not Telling The Story For SEACOR Marine Holdings Inc. (NYSE:SMHI)
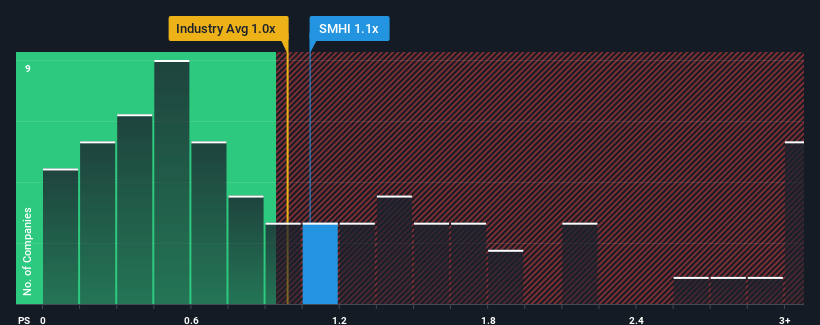
It's not a stretch to say that SEACOR Marine Holdings Inc.'s (NYSE:SMHI) price-to-sales (or "P/S") ratio of 1.1x right now seems quite "middle-of-the-road" for companies in the Energy Services industry in the United States, where the median P/S ratio is around 1x. However, investors might be overlooking a clear opportunity or potential setback if there is no rational basis for the P/S.
View our latest analysis for SEACOR Marine Holdings
How SEACOR Marine Holdings Has Been Performing
The revenue growth achieved at SEACOR Marine Holdings over the last year would be more than acceptable for most companies. Perhaps the market is expecting future revenue performance to only keep up with the broader industry, which has keeping the P/S in line with expectations. Those who are bullish on SEACOR Marine Holdings will be hoping that this isn't the case, so that they can pick up the stock at a lower valuation.
We don't have analyst forecasts, but you can see how recent trends are setting up the company for the future by checking out our free report on SEACOR Marine Holdings' earnings, revenue and cash flow.
What Are Revenue Growth Metrics Telling Us About The P/S?
In order to justify its P/S ratio, SEACOR Marine Holdings would need to produce growth that's similar to the industry.
Taking a look back first, we see that the company grew revenue by an impressive 27% last year. Revenue has also lifted 25% in aggregate from three years ago, mostly thanks to the last 12 months of growth. Accordingly, shareholders would have probably been satisfied with the medium-term rates of revenue growth.
This is in contrast to the rest of the industry, which is expected to grow by 19% over the next year, materially higher than the company's recent medium-term annualised growth rates.
In light of this, it's curious that SEACOR Marine Holdings' P/S sits in line with the majority of other companies. Apparently many investors in the company are less bearish than recent times would indicate and aren't willing to let go of their stock right now. They may be setting themselves up for future disappointment if the P/S falls to levels more in line with recent growth rates.
What We Can Learn From SEACOR Marine Holdings' P/S?
Generally, our preference is to limit the use of the price-to-sales ratio to establishing what the market thinks about the overall health of a company.
Our examination of SEACOR Marine Holdings revealed its poor three-year revenue trends aren't resulting in a lower P/S as per our expectations, given they look worse than current industry outlook. When we see weak revenue with slower than industry growth, we suspect the share price is at risk of declining, bringing the P/S back in line with expectations. If recent medium-term revenue trends continue, the probability of a share price decline will become quite substantial, placing shareholders at risk.
It is also worth noting that we have found 3 warning signs for SEACOR Marine Holdings (1 shouldn't be ignored!) that you need to take into consideration.
It's important to make sure you look for a great company, not just the first idea you come across. So if growing profitability aligns with your idea of a great company, take a peek at this free list of interesting companies with strong recent earnings growth (and a low P/E).
Have feedback on this article? Concerned about the content? Get in touch with us directly. Alternatively, email editorial-team (at) simplywallst.com.
This article by Simply Wall St is general in nature. We provide commentary based on historical data and analyst forecasts only using an unbiased methodology and our articles are not intended to be financial advice. It does not constitute a recommendation to buy or sell any stock, and does not take account of your objectives, or your financial situation. We aim to bring you long-term focused analysis driven by fundamental data. Note that our analysis may not factor in the latest price-sensitive company announcements or qualitative material. Simply Wall St has no position in any stocks mentioned.
Join A Paid User Research Session
You’ll receive a US$30 Amazon Gift card for 1 hour of your time while helping us build better investing tools for the individual investors like yourself. Sign up here
