
 Yahoo Finance
 Returns At Textainer Group Holdings (NYSE:TGH) Appear To Be Weighed Down
What trends should we look for it we want to identify stocks that can multiply in value over the long term? Amongst other things, we'll want to see two things; firstly, a growing return on capital employed (ROCE) and secondly, an expansion in the company's amount of capital employed. Basically this means that a company has profitable initiatives that it can continue to reinvest in, which is a trait of a compounding machine. In light of that, when we looked at Textainer Group Holdings (NYSE:TGH) and its ROCE trend, we weren't exactly thrilled.
Understanding Return On Capital Employed (ROCE)
Just to clarify if you're unsure, ROCE is a metric for evaluating how much pre-tax income (in percentage terms) a company earns on the capital invested in its business. Analysts use this formula to calculate it for Textainer Group Holdings:
Return on Capital Employed = Earnings Before Interest and Tax (EBIT) ÷ (Total Assets - Current Liabilities)
0.054 = US$328m ÷ (US$6.8b - US$689m) (Based on the trailing twelve months to June 2021).
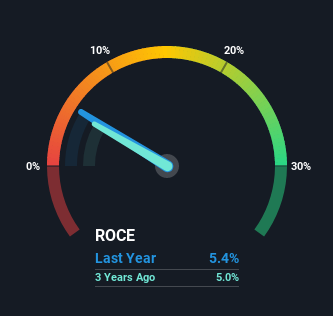
Therefore, Textainer Group Holdings has an ROCE of 5.4%. In absolute terms, that's a low return and it also under-performs the Trade Distributors industry average of 11%.
View our latest analysis for Textainer Group Holdings
Above you can see how the current ROCE for Textainer Group Holdings compares to its prior returns on capital, but there's only so much you can tell from the past. If you'd like to see what analysts are forecasting going forward, you should check out our free report for Textainer Group Holdings.
What Does the ROCE Trend For Textainer Group Holdings Tell Us?
The returns on capital haven't changed much for Textainer Group Holdings in recent years. Over the past five years, ROCE has remained relatively flat at around 5.4% and the business has deployed 48% more capital into its operations. Given the company has increased the amount of capital employed, it appears the investments that have been made simply don't provide a high return on capital.
In Conclusion...
As we've seen above, Textainer Group Holdings' returns on capital haven't increased but it is reinvesting in the business. Yet to long term shareholders the stock has gifted them an incredible 419% return in the last five years, so the market appears to be rosy about its future. Ultimately, if the underlying trends persist, we wouldn't hold our breath on it being a multi-bagger going forward.
Textainer Group Holdings does come with some risks though, we found 4 warning signs in our investment analysis, and 2 of those are potentially serious...
For those who like to invest in solid companies, check out this free list of companies with solid balance sheets and high returns on equity.
This article by Simply Wall St is general in nature. We provide commentary based on historical data and analyst forecasts only using an unbiased methodology and our articles are not intended to be financial advice. It does not constitute a recommendation to buy or sell any stock, and does not take account of your objectives, or your financial situation. We aim to bring you long-term focused analysis driven by fundamental data. Note that our analysis may not factor in the latest price-sensitive company announcements or qualitative material. Simply Wall St has no position in any stocks mentioned.
Have feedback on this article? Concerned about the content? Get in touch with us directly. Alternatively, email editorial-team (at) simplywallst.com.
