
 Yahoo Finance
 The Returns At Six Flags Entertainment (NYSE:SIX) Aren't Growing
What trends should we look for it we want to identify stocks that can multiply in value over the long term? Ideally, a business will show two trends; firstly a growing return on capital employed (ROCE) and secondly, an increasing amount of capital employed. Ultimately, this demonstrates that it's a business that is reinvesting profits at increasing rates of return. However, after investigating Six Flags Entertainment (NYSE:SIX), we don't think it's current trends fit the mold of a multi-bagger.
What is Return On Capital Employed (ROCE)?
Just to clarify if you're unsure, ROCE is a metric for evaluating how much pre-tax income (in percentage terms) a company earns on the capital invested in its business. To calculate this metric for Six Flags Entertainment, this is the formula:
Return on Capital Employed = Earnings Before Interest and Tax (EBIT) ÷ (Total Assets - Current Liabilities)
0.11 = US$271m ÷ (US$3.1b - US$522m) (Based on the trailing twelve months to October 2021).
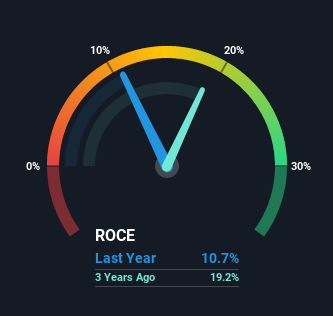
Therefore, Six Flags Entertainment has an ROCE of 11%. In absolute terms, that's a pretty normal return, and it's somewhat close to the Hospitality industry average of 9.0%.
See our latest analysis for Six Flags Entertainment
In the above chart we have measured Six Flags Entertainment's prior ROCE against its prior performance, but the future is arguably more important. If you'd like to see what analysts are forecasting going forward, you should check out our free report for Six Flags Entertainment.
What The Trend Of ROCE Can Tell Us
There hasn't been much to report for Six Flags Entertainment's returns and its level of capital employed because both metrics have been steady for the past five years. Businesses with these traits tend to be mature and steady operations because they're past the growth phase. So unless we see a substantial change at Six Flags Entertainment in terms of ROCE and additional investments being made, we wouldn't hold our breath on it being a multi-bagger.
Our Take On Six Flags Entertainment's ROCE
In summary, Six Flags Entertainment isn't compounding its earnings but is generating stable returns on the same amount of capital employed. And investors appear hesitant that the trends will pick up because the stock has fallen 16% in the last five years. In any case, the stock doesn't have these traits of a multi-bagger discussed above, so if that's what you're looking for, we think you'd have more luck elsewhere.
One more thing: We've identified 3 warning signs with Six Flags Entertainment (at least 2 which make us uncomfortable) , and understanding them would certainly be useful.
For those who like to invest in solid companies, check out this free list of companies with solid balance sheets and high returns on equity.
Have feedback on this article? Concerned about the content? Get in touch with us directly. Alternatively, email editorial-team (at) simplywallst.com.
This article by Simply Wall St is general in nature. We provide commentary based on historical data and analyst forecasts only using an unbiased methodology and our articles are not intended to be financial advice. It does not constitute a recommendation to buy or sell any stock, and does not take account of your objectives, or your financial situation. We aim to bring you long-term focused analysis driven by fundamental data. Note that our analysis may not factor in the latest price-sensitive company announcements or qualitative material. Simply Wall St has no position in any stocks mentioned.
