
 Yahoo Finance
 Returns At OM Holdings (ASX:OMH) Are On The Way Up
If you're not sure where to start when looking for the next multi-bagger, there are a few key trends you should keep an eye out for. One common approach is to try and find a company with returns on capital employed (ROCE) that are increasing, in conjunction with a growing amount of capital employed. Put simply, these types of businesses are compounding machines, meaning they are continually reinvesting their earnings at ever-higher rates of return. With that in mind, we've noticed some promising trends at OM Holdings (ASX:OMH) so let's look a bit deeper.
Return On Capital Employed (ROCE): What is it?
For those who don't know, ROCE is a measure of a company's yearly pre-tax profit (its return), relative to the capital employed in the business. The formula for this calculation on OM Holdings is:
Return on Capital Employed = Earnings Before Interest and Tax (EBIT) ÷ (Total Assets - Current Liabilities)
0.0064 = AU$5.3m ÷ (AU$1.1b - AU$299m) (Based on the trailing twelve months to December 2020).
So, OM Holdings has an ROCE of 0.6%. Ultimately, that's a low return and it under-performs the Metals and Mining industry average of 8.9%.
See our latest analysis for OM Holdings
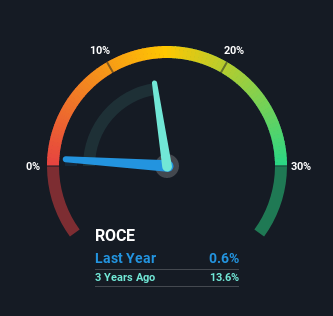
Historical performance is a great place to start when researching a stock so above you can see the gauge for OM Holdings' ROCE against it's prior returns. If you'd like to look at how OM Holdings has performed in the past in other metrics, you can view this free graph of past earnings, revenue and cash flow.
The Trend Of ROCE
Shareholders will be relieved that OM Holdings has broken into profitability. The company was generating losses five years ago, but has managed to turn it around and as we saw earlier is now earning 0.6%, which is always encouraging. On top of that, what's interesting is that the amount of capital being employed has remained steady, so the business hasn't needed to put any additional money to work to generate these higher returns. That being said, while an increase in efficiency is no doubt appealing, it'd be helpful to know if the company does have any investment plans going forward. So if you're looking for high growth, you'll want to see a business's capital employed also increasing.
The Bottom Line On OM Holdings' ROCE
In summary, we're delighted to see that OM Holdings has been able to increase efficiencies and earn higher rates of return on the same amount of capital. And with the stock having performed exceptionally well over the last five years, these patterns are being accounted for by investors. Therefore, we think it would be worth your time to check if these trends are going to continue.
One final note, you should learn about the 3 warning signs we've spotted with OM Holdings (including 1 which makes us a bit uncomfortable) .
For those who like to invest in solid companies, check out this free list of companies with solid balance sheets and high returns on equity.
This article by Simply Wall St is general in nature. It does not constitute a recommendation to buy or sell any stock, and does not take account of your objectives, or your financial situation. We aim to bring you long-term focused analysis driven by fundamental data. Note that our analysis may not factor in the latest price-sensitive company announcements or qualitative material. Simply Wall St has no position in any stocks mentioned.
Have feedback on this article? Concerned about the content? Get in touch with us directly. Alternatively, email editorial-team (at) simplywallst.com.
