
 Yahoo Finance
 Returns Are Gaining Momentum At Harbour Energy (LON:HBR)
What trends should we look for it we want to identify stocks that can multiply in value over the long term? Firstly, we'd want to identify a growing return on capital employed (ROCE) and then alongside that, an ever-increasing base of capital employed. Basically this means that a company has profitable initiatives that it can continue to reinvest in, which is a trait of a compounding machine. Speaking of which, we noticed some great changes in Harbour Energy's (LON:HBR) returns on capital, so let's have a look.
Return On Capital Employed (ROCE): What Is It?
If you haven't worked with ROCE before, it measures the 'return' (pre-tax profit) a company generates from capital employed in its business. Analysts use this formula to calculate it for Harbour Energy:
Return on Capital Employed = Earnings Before Interest and Tax (EBIT) ÷ (Total Assets - Current Liabilities)
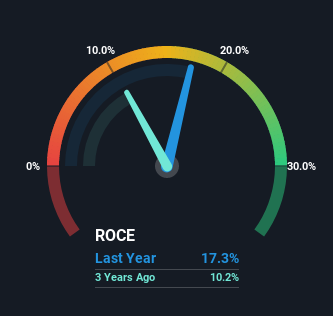
0.17 = US$1.6b ÷ (US$15b - US$6.0b) (Based on the trailing twelve months to June 2022).
Thus, Harbour Energy has an ROCE of 17%. On its own, that's a standard return, however it's much better than the 11% generated by the Oil and Gas industry.
View our latest analysis for Harbour Energy
In the above chart we have measured Harbour Energy's prior ROCE against its prior performance, but the future is arguably more important. If you'd like, you can check out the forecasts from the analysts covering Harbour Energy here for free.
How Are Returns Trending?
The trends we've noticed at Harbour Energy are quite reassuring. The numbers show that in the last five years, the returns generated on capital employed have grown considerably to 17%. The amount of capital employed has increased too, by 277%. This can indicate that there's plenty of opportunities to invest capital internally and at ever higher rates, a combination that's common among multi-baggers.
For the record though, there was a noticeable increase in the company's current liabilities over the period, so we would attribute some of the ROCE growth to that. The current liabilities has increased to 39% of total assets, so the business is now more funded by the likes of its suppliers or short-term creditors. Keep an eye out for future increases because when the ratio of current liabilities to total assets gets particularly high, this can introduce some new risks for the business.
The Bottom Line
A company that is growing its returns on capital and can consistently reinvest in itself is a highly sought after trait, and that's what Harbour Energy has. And given the stock has remained rather flat over the last year, there might be an opportunity here if other metrics are strong. That being the case, research into the company's current valuation metrics and future prospects seems fitting.
Harbour Energy does come with some risks though, we found 4 warning signs in our investment analysis, and 1 of those can't be ignored...
While Harbour Energy may not currently earn the highest returns, we've compiled a list of companies that currently earn more than 25% return on equity. Check out this free list here.
Have feedback on this article? Concerned about the content? Get in touch with us directly. Alternatively, email editorial-team (at) simplywallst.com.
This article by Simply Wall St is general in nature. We provide commentary based on historical data and analyst forecasts only using an unbiased methodology and our articles are not intended to be financial advice. It does not constitute a recommendation to buy or sell any stock, and does not take account of your objectives, or your financial situation. We aim to bring you long-term focused analysis driven by fundamental data. Note that our analysis may not factor in the latest price-sensitive company announcements or qualitative material. Simply Wall St has no position in any stocks mentioned.
Join A Paid User Research Session
You’ll receive a US$30 Amazon Gift card for 1 hour of your time while helping us build better investing tools for the individual investors like yourself. Sign up here
