
 Yahoo Finance
 Returns Are Gaining Momentum At Flex (NASDAQ:FLEX)
What trends should we look for it we want to identify stocks that can multiply in value over the long term? In a perfect world, we'd like to see a company investing more capital into its business and ideally the returns earned from that capital are also increasing. If you see this, it typically means it's a company with a great business model and plenty of profitable reinvestment opportunities. So on that note, Flex (NASDAQ:FLEX) looks quite promising in regards to its trends of return on capital.
What Is Return On Capital Employed (ROCE)?
For those that aren't sure what ROCE is, it measures the amount of pre-tax profits a company can generate from the capital employed in its business. The formula for this calculation on Flex is:
Return on Capital Employed = Earnings Before Interest and Tax (EBIT) ÷ (Total Assets - Current Liabilities)
0.13 = US$1.2b ÷ (US$21b - US$12b) (Based on the trailing twelve months to December 2022).
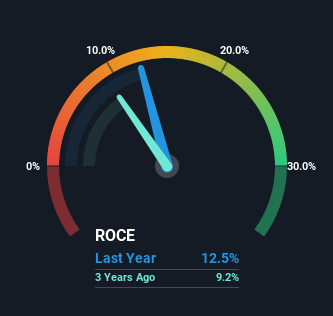
So, Flex has an ROCE of 13%. That's a pretty standard return and it's in line with the industry average of 13%.
See our latest analysis for Flex
In the above chart we have measured Flex's prior ROCE against its prior performance, but the future is arguably more important. If you're interested, you can view the analysts predictions in our free report on analyst forecasts for the company.
The Trend Of ROCE
The trends we've noticed at Flex are quite reassuring. Over the last five years, returns on capital employed have risen substantially to 13%. The company is effectively making more money per dollar of capital used, and it's worth noting that the amount of capital has increased too, by 44%. The increasing returns on a growing amount of capital is common amongst multi-baggers and that's why we're impressed.
Another thing to note, Flex has a high ratio of current liabilities to total assets of 56%. This can bring about some risks because the company is basically operating with a rather large reliance on its suppliers or other sorts of short-term creditors. While it's not necessarily a bad thing, it can be beneficial if this ratio is lower.
What We Can Learn From Flex's ROCE
All in all, it's terrific to see that Flex is reaping the rewards from prior investments and is growing its capital base. And investors seem to expect more of this going forward, since the stock has rewarded shareholders with a 41% return over the last five years. In light of that, we think it's worth looking further into this stock because if Flex can keep these trends up, it could have a bright future ahead.
On a separate note, we've found 2 warning signs for Flex you'll probably want to know about.
While Flex isn't earning the highest return, check out this free list of companies that are earning high returns on equity with solid balance sheets.
Have feedback on this article? Concerned about the content? Get in touch with us directly. Alternatively, email editorial-team (at) simplywallst.com.
This article by Simply Wall St is general in nature. We provide commentary based on historical data and analyst forecasts only using an unbiased methodology and our articles are not intended to be financial advice. It does not constitute a recommendation to buy or sell any stock, and does not take account of your objectives, or your financial situation. We aim to bring you long-term focused analysis driven by fundamental data. Note that our analysis may not factor in the latest price-sensitive company announcements or qualitative material. Simply Wall St has no position in any stocks mentioned.
Join A Paid User Research Session
You’ll receive a US$30 Amazon Gift card for 1 hour of your time while helping us build better investing tools for the individual investors like yourself. Sign up here
