
 Yahoo Finance
 Returns Are Gaining Momentum At Domain Holdings Australia (ASX:DHG)
If we want to find a stock that could multiply over the long term, what are the underlying trends we should look for? Typically, we'll want to notice a trend of growing return on capital employed (ROCE) and alongside that, an expanding base of capital employed. This shows us that it's a compounding machine, able to continually reinvest its earnings back into the business and generate higher returns. So when we looked at Domain Holdings Australia (ASX:DHG) and its trend of ROCE, we really liked what we saw.
Understanding Return On Capital Employed (ROCE)
For those who don't know, ROCE is a measure of a company's yearly pre-tax profit (its return), relative to the capital employed in the business. The formula for this calculation on Domain Holdings Australia is:
Return on Capital Employed = Earnings Before Interest and Tax (EBIT) ÷ (Total Assets - Current Liabilities)
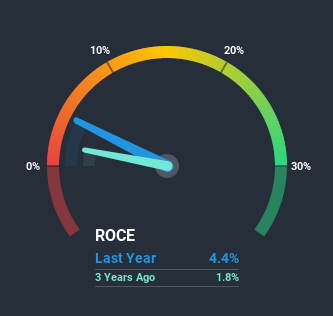
0.044 = AU$54m ÷ (AU$1.3b - AU$55m) (Based on the trailing twelve months to December 2020).
So, Domain Holdings Australia has an ROCE of 4.4%. In absolute terms, that's a low return and it also under-performs the Interactive Media and Services industry average of 13%.
Check out our latest analysis for Domain Holdings Australia
Above you can see how the current ROCE for Domain Holdings Australia compares to its prior returns on capital, but there's only so much you can tell from the past. If you'd like to see what analysts are forecasting going forward, you should check out our free report for Domain Holdings Australia.
How Are Returns Trending?
It's nice to see that ROCE is headed in the right direction, even if it is still relatively low. We found that the returns on capital employed over the last three years have risen by 143%. That's a very favorable trend because this means that the company is earning more per dollar of capital that's being employed. Speaking of capital employed, the company is actually utilizing 26% less than it was three years ago, which can be indicative of a business that's improving its efficiency. If this trend continues, the business might be getting more efficient but it's shrinking in terms of total assets.
The Bottom Line On Domain Holdings Australia's ROCE
From what we've seen above, Domain Holdings Australia has managed to increase it's returns on capital all the while reducing it's capital base. Since the stock has returned a solid 52% to shareholders over the last three years, it's fair to say investors are beginning to recognize these changes. In light of that, we think it's worth looking further into this stock because if Domain Holdings Australia can keep these trends up, it could have a bright future ahead.
Before jumping to any conclusions though, we need to know what value we're getting for the current share price. That's where you can check out our FREE intrinsic value estimation that compares the share price and estimated value.
While Domain Holdings Australia isn't earning the highest return, check out this free list of companies that are earning high returns on equity with solid balance sheets.
This article by Simply Wall St is general in nature. It does not constitute a recommendation to buy or sell any stock, and does not take account of your objectives, or your financial situation. We aim to bring you long-term focused analysis driven by fundamental data. Note that our analysis may not factor in the latest price-sensitive company announcements or qualitative material. Simply Wall St has no position in any stocks mentioned.
Have feedback on this article? Concerned about the content? Get in touch with us directly. Alternatively, email editorial-team (at) simplywallst.com.
