
 Yahoo Finance
 Returns Are Gaining Momentum At Boart Longyear Group (ASX:BLY)
What are the early trends we should look for to identify a stock that could multiply in value over the long term? Ideally, a business will show two trends; firstly a growing return on capital employed (ROCE) and secondly, an increasing amount of capital employed. Basically this means that a company has profitable initiatives that it can continue to reinvest in, which is a trait of a compounding machine. So when we looked at Boart Longyear Group (ASX:BLY) and its trend of ROCE, we really liked what we saw.
What is Return On Capital Employed (ROCE)?
Just to clarify if you're unsure, ROCE is a metric for evaluating how much pre-tax income (in percentage terms) a company earns on the capital invested in its business. To calculate this metric for Boart Longyear Group, this is the formula:
Return on Capital Employed = Earnings Before Interest and Tax (EBIT) ÷ (Total Assets - Current Liabilities)
0.089 = US$43m ÷ (US$682m - US$199m) (Based on the trailing twelve months to June 2021).
Thus, Boart Longyear Group has an ROCE of 8.9%. On its own that's a low return on capital but it's in line with the industry's average returns of 9.4%.
See our latest analysis for Boart Longyear Group
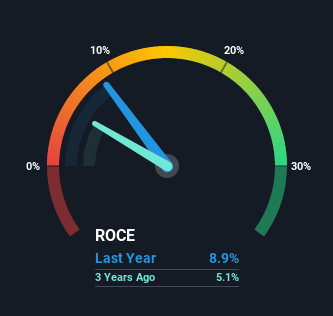
Historical performance is a great place to start when researching a stock so above you can see the gauge for Boart Longyear Group's ROCE against it's prior returns. If you're interested in investigating Boart Longyear Group's past further, check out this free graph of past earnings, revenue and cash flow.
The Trend Of ROCE
Shareholders will be relieved that Boart Longyear Group has broken into profitability. The company was generating losses five years ago, but has managed to turn it around and as we saw earlier is now earning 8.9%, which is always encouraging. While returns have increased, the amount of capital employed by Boart Longyear Group has remained flat over the period. With no noticeable increase in capital employed, it's worth knowing what the company plans on doing going forward in regards to reinvesting and growing the business. Because in the end, a business can only get so efficient.
Our Take On Boart Longyear Group's ROCE
To bring it all together, Boart Longyear Group has done well to increase the returns it's generating from its capital employed. However the stock is down a substantial 100% in the last five years so there could be other areas of the business hurting its prospects. Regardless, we think the underlying fundamentals warrant this stock for further investigation.
If you'd like to know more about Boart Longyear Group, we've spotted 3 warning signs, and 2 of them are concerning.
While Boart Longyear Group isn't earning the highest return, check out this free list of companies that are earning high returns on equity with solid balance sheets.
This article by Simply Wall St is general in nature. We provide commentary based on historical data and analyst forecasts only using an unbiased methodology and our articles are not intended to be financial advice. It does not constitute a recommendation to buy or sell any stock, and does not take account of your objectives, or your financial situation. We aim to bring you long-term focused analysis driven by fundamental data. Note that our analysis may not factor in the latest price-sensitive company announcements or qualitative material. Simply Wall St has no position in any stocks mentioned.
Have feedback on this article? Concerned about the content? Get in touch with us directly. Alternatively, email editorial-team (at) simplywallst.com.
