
 Yahoo Finance
 Returns At Element Solutions (NYSE:ESI) Are On The Way Up
If you're not sure where to start when looking for the next multi-bagger, there are a few key trends you should keep an eye out for. Typically, we'll want to notice a trend of growing return on capital employed (ROCE) and alongside that, an expanding base of capital employed. Basically this means that a company has profitable initiatives that it can continue to reinvest in, which is a trait of a compounding machine. Speaking of which, we noticed some great changes in Element Solutions' (NYSE:ESI) returns on capital, so let's have a look.
Understanding Return On Capital Employed (ROCE)
Just to clarify if you're unsure, ROCE is a metric for evaluating how much pre-tax income (in percentage terms) a company earns on the capital invested in its business. The formula for this calculation on Element Solutions is:
Return on Capital Employed = Earnings Before Interest and Tax (EBIT) ÷ (Total Assets - Current Liabilities)
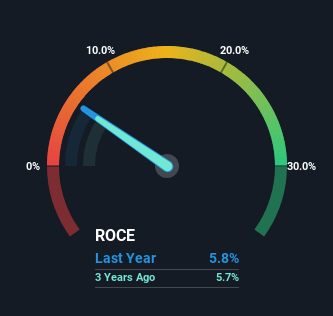
0.058 = US$265m ÷ (US$5.0b - US$369m) (Based on the trailing twelve months to December 2023).
So, Element Solutions has an ROCE of 5.8%. Ultimately, that's a low return and it under-performs the Chemicals industry average of 9.7%.
See our latest analysis for Element Solutions
Above you can see how the current ROCE for Element Solutions compares to its prior returns on capital, but there's only so much you can tell from the past. If you'd like to see what analysts are forecasting going forward, you should check out our free analyst report for Element Solutions .
So How Is Element Solutions' ROCE Trending?
You'd find it hard not to be impressed with the ROCE trend at Element Solutions. The figures show that over the last five years, returns on capital have grown by 87%. The company is now earning US$0.06 per dollar of capital employed. Speaking of capital employed, the company is actually utilizing 44% less than it was five years ago, which can be indicative of a business that's improving its efficiency. Element Solutions may be selling some assets so it's worth investigating if the business has plans for future investments to increase returns further still.
The Bottom Line On Element Solutions' ROCE
In the end, Element Solutions has proven it's capital allocation skills are good with those higher returns from less amount of capital. And with the stock having performed exceptionally well over the last five years, these patterns are being accounted for by investors. So given the stock has proven it has promising trends, it's worth researching the company further to see if these trends are likely to persist.
Element Solutions does come with some risks though, we found 3 warning signs in our investment analysis, and 1 of those is concerning...
While Element Solutions may not currently earn the highest returns, we've compiled a list of companies that currently earn more than 25% return on equity. Check out this free list here.
Have feedback on this article? Concerned about the content? Get in touch with us directly. Alternatively, email editorial-team (at) simplywallst.com.
This article by Simply Wall St is general in nature. We provide commentary based on historical data and analyst forecasts only using an unbiased methodology and our articles are not intended to be financial advice. It does not constitute a recommendation to buy or sell any stock, and does not take account of your objectives, or your financial situation. We aim to bring you long-term focused analysis driven by fundamental data. Note that our analysis may not factor in the latest price-sensitive company announcements or qualitative material. Simply Wall St has no position in any stocks mentioned.
