
 Yahoo Finance
 The Returns At Compass Group (LON:CPG) Provide Us With Signs Of What's To Come
Finding a business that has the potential to grow substantially is not easy, but it is possible if we look at a few key financial metrics. One common approach is to try and find a company with returns on capital employed (ROCE) that are increasing, in conjunction with a growing amount of capital employed. Ultimately, this demonstrates that it's a business that is reinvesting profits at increasing rates of return. In light of that, when we looked at Compass Group (LON:CPG) and its ROCE trend, we weren't exactly thrilled.
What is Return On Capital Employed (ROCE)?
For those that aren't sure what ROCE is, it measures the amount of pre-tax profits a company can generate from the capital employed in its business. Analysts use this formula to calculate it for Compass Group:
Return on Capital Employed = Earnings Before Interest and Tax (EBIT) ÷ (Total Assets - Current Liabilities)
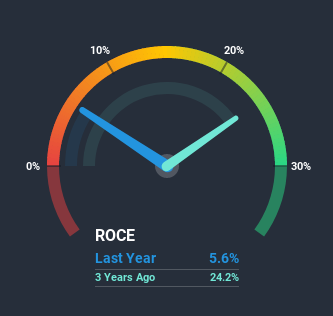
0.056 = UK£570m ÷ (UK£15b - UK£4.5b) (Based on the trailing twelve months to September 2020).
Thus, Compass Group has an ROCE of 5.6%. On its own that's a low return on capital but it's in line with the industry's average returns of 5.5%.
See our latest analysis for Compass Group
In the above chart we have measured Compass Group's prior ROCE against its prior performance, but the future is arguably more important. If you'd like to see what analysts are forecasting going forward, you should check out our free report for Compass Group.
What Does the ROCE Trend For Compass Group Tell Us?
The trend of ROCE doesn't look fantastic because it's fallen from 25% five years ago, while the business's capital employed increased by 103%. That being said, Compass Group raised some capital prior to their latest results being released, so that could partly explain the increase in capital employed. It's unlikely that all of the funds raised have been put to work yet, so as a consequence Compass Group might not have received a full period of earnings contribution from it.
On a side note, Compass Group has done well to pay down its current liabilities to 31% of total assets. That could partly explain why the ROCE has dropped. What's more, this can reduce some aspects of risk to the business because now the company's suppliers or short-term creditors are funding less of its operations. Some would claim this reduces the business' efficiency at generating ROCE since it is now funding more of the operations with its own money.
The Bottom Line On Compass Group's ROCE
From the above analysis, we find it rather worrisome that returns on capital and sales for Compass Group have fallen, meanwhile the business is employing more capital than it was five years ago. In spite of that, the stock has delivered a 36% return to shareholders who held over the last five years. Either way, we aren't huge fans of the current trends and so with that we think you might find better investments elsewhere.
If you want to continue researching Compass Group, you might be interested to know about the 4 warning signs that our analysis has discovered.
If you want to search for solid companies with great earnings, check out this free list of companies with good balance sheets and impressive returns on equity.
This article by Simply Wall St is general in nature. It does not constitute a recommendation to buy or sell any stock, and does not take account of your objectives, or your financial situation. We aim to bring you long-term focused analysis driven by fundamental data. Note that our analysis may not factor in the latest price-sensitive company announcements or qualitative material. Simply Wall St has no position in any stocks mentioned.
Have feedback on this article? Concerned about the content? Get in touch with us directly. Alternatively, email editorial-team (at) simplywallst.com.
