
 Yahoo Finance
 Returns On Capital Are A Standout For Enero Group (ASX:EGG)
If we want to find a potential multi-bagger, often there are underlying trends that can provide clues. Firstly, we'll want to see a proven return on capital employed (ROCE) that is increasing, and secondly, an expanding base of capital employed. Basically this means that a company has profitable initiatives that it can continue to reinvest in, which is a trait of a compounding machine. So when we looked at the ROCE trend of Enero Group (ASX:EGG) we really liked what we saw.
Understanding Return On Capital Employed (ROCE)
For those that aren't sure what ROCE is, it measures the amount of pre-tax profits a company can generate from the capital employed in its business. Analysts use this formula to calculate it for Enero Group:
Return on Capital Employed = Earnings Before Interest and Tax (EBIT) ÷ (Total Assets - Current Liabilities)
0.21 = AU$49m ÷ (AU$360m - AU$124m) (Based on the trailing twelve months to December 2023).
Therefore, Enero Group has an ROCE of 21%. That's a fantastic return and not only that, it outpaces the average of 8.2% earned by companies in a similar industry.
Check out our latest analysis for Enero Group
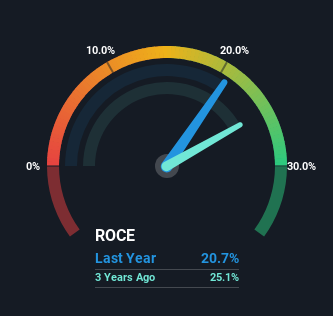
Above you can see how the current ROCE for Enero Group compares to its prior returns on capital, but there's only so much you can tell from the past. If you're interested, you can view the analysts predictions in our free analyst report for Enero Group .
How Are Returns Trending?
Enero Group is displaying some positive trends. The data shows that returns on capital have increased substantially over the last five years to 21%. The amount of capital employed has increased too, by 66%. So we're very much inspired by what we're seeing at Enero Group thanks to its ability to profitably reinvest capital.
Our Take On Enero Group's ROCE
To sum it up, Enero Group has proven it can reinvest in the business and generate higher returns on that capital employed, which is terrific. And with a respectable 60% awarded to those who held the stock over the last five years, you could argue that these developments are starting to get the attention they deserve. Therefore, we think it would be worth your time to check if these trends are going to continue.
One more thing to note, we've identified 2 warning signs with Enero Group and understanding these should be part of your investment process.
If you want to search for more stocks that have been earning high returns, check out this free list of stocks with solid balance sheets that are also earning high returns on equity.
Have feedback on this article? Concerned about the content? Get in touch with us directly. Alternatively, email editorial-team (at) simplywallst.com.
This article by Simply Wall St is general in nature. We provide commentary based on historical data and analyst forecasts only using an unbiased methodology and our articles are not intended to be financial advice. It does not constitute a recommendation to buy or sell any stock, and does not take account of your objectives, or your financial situation. We aim to bring you long-term focused analysis driven by fundamental data. Note that our analysis may not factor in the latest price-sensitive company announcements or qualitative material. Simply Wall St has no position in any stocks mentioned.
