
 Yahoo Finance
 The Returns On Capital At Silverlake Axis (SGX:5CP) Don't Inspire Confidence
If we want to find a potential multi-bagger, often there are underlying trends that can provide clues. One common approach is to try and find a company with returns on capital employed (ROCE) that are increasing, in conjunction with a growing amount of capital employed. If you see this, it typically means it's a company with a great business model and plenty of profitable reinvestment opportunities. In light of that, when we looked at Silverlake Axis (SGX:5CP) and its ROCE trend, we weren't exactly thrilled.
What Is Return On Capital Employed (ROCE)?
For those that aren't sure what ROCE is, it measures the amount of pre-tax profits a company can generate from the capital employed in its business. To calculate this metric for Silverlake Axis, this is the formula:
Return on Capital Employed = Earnings Before Interest and Tax (EBIT) ÷ (Total Assets - Current Liabilities)
0.15 = RM203m ÷ (RM1.6b - RM242m) (Based on the trailing twelve months to December 2023).
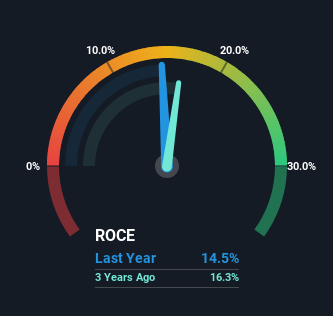
So, Silverlake Axis has an ROCE of 15%. On its own, that's a standard return, however it's much better than the 8.9% generated by the Software industry.
See our latest analysis for Silverlake Axis
In the above chart we have measured Silverlake Axis' prior ROCE against its prior performance, but the future is arguably more important. If you'd like, you can check out the forecasts from the analysts covering Silverlake Axis for free.
How Are Returns Trending?
When we looked at the ROCE trend at Silverlake Axis, we didn't gain much confidence. To be more specific, ROCE has fallen from 29% over the last five years. However it looks like Silverlake Axis might be reinvesting for long term growth because while capital employed has increased, the company's sales haven't changed much in the last 12 months. It may take some time before the company starts to see any change in earnings from these investments.
In Conclusion...
Bringing it all together, while we're somewhat encouraged by Silverlake Axis' reinvestment in its own business, we're aware that returns are shrinking. And in the last five years, the stock has given away 39% so the market doesn't look too hopeful on these trends strengthening any time soon. In any case, the stock doesn't have these traits of a multi-bagger discussed above, so if that's what you're looking for, we think you'd have more luck elsewhere.
Silverlake Axis could be trading at an attractive price in other respects, so you might find our free intrinsic value estimation for 5CP on our platform quite valuable.
While Silverlake Axis may not currently earn the highest returns, we've compiled a list of companies that currently earn more than 25% return on equity. Check out this free list here.
Have feedback on this article? Concerned about the content? Get in touch with us directly. Alternatively, email editorial-team (at) simplywallst.com.
This article by Simply Wall St is general in nature. We provide commentary based on historical data and analyst forecasts only using an unbiased methodology and our articles are not intended to be financial advice. It does not constitute a recommendation to buy or sell any stock, and does not take account of your objectives, or your financial situation. We aim to bring you long-term focused analysis driven by fundamental data. Note that our analysis may not factor in the latest price-sensitive company announcements or qualitative material. Simply Wall St has no position in any stocks mentioned.
