
 Yahoo Finance
 Returns On Capital Signal Tricky Times Ahead For Coles Group (ASX:COL)
If you're looking for a multi-bagger, there's a few things to keep an eye out for. One common approach is to try and find a company with returns on capital employed (ROCE) that are increasing, in conjunction with a growing amount of capital employed. Basically this means that a company has profitable initiatives that it can continue to reinvest in, which is a trait of a compounding machine. However, after briefly looking over the numbers, we don't think Coles Group (ASX:COL) has the makings of a multi-bagger going forward, but let's have a look at why that may be.
What Is Return On Capital Employed (ROCE)?
If you haven't worked with ROCE before, it measures the 'return' (pre-tax profit) a company generates from capital employed in its business. The formula for this calculation on Coles Group is:
Return on Capital Employed = Earnings Before Interest and Tax (EBIT) ÷ (Total Assets - Current Liabilities)
0.14 = AU$1.7b ÷ (AU$19b - AU$7.1b) (Based on the trailing twelve months to December 2023).
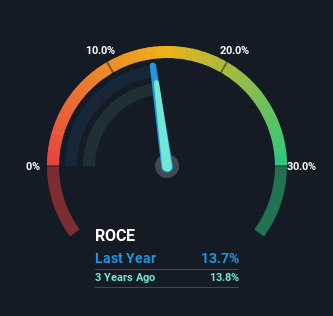
Therefore, Coles Group has an ROCE of 14%. In absolute terms, that's a satisfactory return, but compared to the Consumer Retailing industry average of 11% it's much better.
See our latest analysis for Coles Group
In the above chart we have measured Coles Group's prior ROCE against its prior performance, but the future is arguably more important. If you'd like to see what analysts are forecasting going forward, you should check out our free analyst report for Coles Group .
The Trend Of ROCE
On the surface, the trend of ROCE at Coles Group doesn't inspire confidence. Over the last five years, returns on capital have decreased to 14% from 24% five years ago. Meanwhile, the business is utilizing more capital but this hasn't moved the needle much in terms of sales in the past 12 months, so this could reflect longer term investments. It may take some time before the company starts to see any change in earnings from these investments.
On a side note, Coles Group has done well to pay down its current liabilities to 36% of total assets. That could partly explain why the ROCE has dropped. What's more, this can reduce some aspects of risk to the business because now the company's suppliers or short-term creditors are funding less of its operations. Since the business is basically funding more of its operations with it's own money, you could argue this has made the business less efficient at generating ROCE.
Our Take On Coles Group's ROCE
To conclude, we've found that Coles Group is reinvesting in the business, but returns have been falling. Although the market must be expecting these trends to improve because the stock has gained 57% over the last five years. But if the trajectory of these underlying trends continue, we think the likelihood of it being a multi-bagger from here isn't high.
On a final note, we've found 1 warning sign for Coles Group that we think you should be aware of.
While Coles Group isn't earning the highest return, check out this free list of companies that are earning high returns on equity with solid balance sheets.
Have feedback on this article? Concerned about the content? Get in touch with us directly. Alternatively, email editorial-team (at) simplywallst.com.
This article by Simply Wall St is general in nature. We provide commentary based on historical data and analyst forecasts only using an unbiased methodology and our articles are not intended to be financial advice. It does not constitute a recommendation to buy or sell any stock, and does not take account of your objectives, or your financial situation. We aim to bring you long-term focused analysis driven by fundamental data. Note that our analysis may not factor in the latest price-sensitive company announcements or qualitative material. Simply Wall St has no position in any stocks mentioned.
