
 Yahoo Finance
 Returns On Capital Signal Tricky Times Ahead For MBB (ETR:MBB)
Did you know there are some financial metrics that can provide clues of a potential multi-bagger? Amongst other things, we'll want to see two things; firstly, a growing return on capital employed (ROCE) and secondly, an expansion in the company's amount of capital employed. If you see this, it typically means it's a company with a great business model and plenty of profitable reinvestment opportunities. However, after briefly looking over the numbers, we don't think MBB (ETR:MBB) has the makings of a multi-bagger going forward, but let's have a look at why that may be.
What Is Return On Capital Employed (ROCE)?
For those that aren't sure what ROCE is, it measures the amount of pre-tax profits a company can generate from the capital employed in its business. To calculate this metric for MBB, this is the formula:
Return on Capital Employed = Earnings Before Interest and Tax (EBIT) ÷ (Total Assets - Current Liabilities)
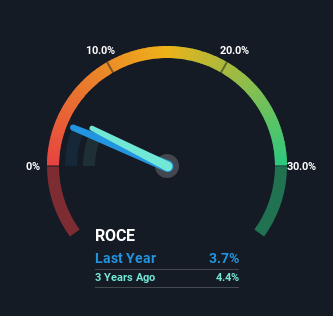
0.037 = €32m ÷ (€1.1b - €282m) (Based on the trailing twelve months to December 2023).
Therefore, MBB has an ROCE of 3.7%. On its own that's a low return on capital but it's in line with the industry's average returns of 3.7%.
View our latest analysis for MBB
Above you can see how the current ROCE for MBB compares to its prior returns on capital, but there's only so much you can tell from the past. If you'd like, you can check out the forecasts from the analysts covering MBB for free.
The Trend Of ROCE
On the surface, the trend of ROCE at MBB doesn't inspire confidence. To be more specific, ROCE has fallen from 6.5% over the last five years. Meanwhile, the business is utilizing more capital but this hasn't moved the needle much in terms of sales in the past 12 months, so this could reflect longer term investments. It may take some time before the company starts to see any change in earnings from these investments.
The Key Takeaway
Bringing it all together, while we're somewhat encouraged by MBB's reinvestment in its own business, we're aware that returns are shrinking. Unsurprisingly, the stock has only gained 38% over the last five years, which potentially indicates that investors are accounting for this going forward. So if you're looking for a multi-bagger, the underlying trends indicate you may have better chances elsewhere.
While MBB doesn't shine too bright in this respect, it's still worth seeing if the company is trading at attractive prices. You can find that out with our FREE intrinsic value estimation for MBB on our platform.
While MBB isn't earning the highest return, check out this free list of companies that are earning high returns on equity with solid balance sheets.
Have feedback on this article? Concerned about the content? Get in touch with us directly. Alternatively, email editorial-team (at) simplywallst.com.
This article by Simply Wall St is general in nature. We provide commentary based on historical data and analyst forecasts only using an unbiased methodology and our articles are not intended to be financial advice. It does not constitute a recommendation to buy or sell any stock, and does not take account of your objectives, or your financial situation. We aim to bring you long-term focused analysis driven by fundamental data. Note that our analysis may not factor in the latest price-sensitive company announcements or qualitative material. Simply Wall St has no position in any stocks mentioned.
