
 Yahoo Finance
 Returns On Capital Signal Tricky Times Ahead For Beacon Lighting Group (ASX:BLX)
What are the early trends we should look for to identify a stock that could multiply in value over the long term? Amongst other things, we'll want to see two things; firstly, a growing return on capital employed (ROCE) and secondly, an expansion in the company's amount of capital employed. Ultimately, this demonstrates that it's a business that is reinvesting profits at increasing rates of return. In light of that, when we looked at Beacon Lighting Group (ASX:BLX) and its ROCE trend, we weren't exactly thrilled.
What Is Return On Capital Employed (ROCE)?
Just to clarify if you're unsure, ROCE is a metric for evaluating how much pre-tax income (in percentage terms) a company earns on the capital invested in its business. Analysts use this formula to calculate it for Beacon Lighting Group:
Return on Capital Employed = Earnings Before Interest and Tax (EBIT) ÷ (Total Assets - Current Liabilities)
0.19 = AU$51m ÷ (AU$362m - AU$91m) (Based on the trailing twelve months to December 2023).
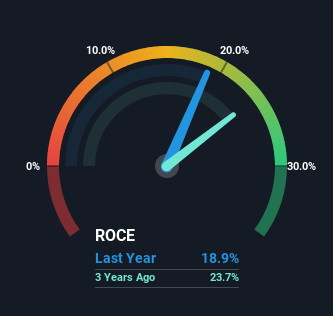
Thus, Beacon Lighting Group has an ROCE of 19%. In absolute terms, that's a pretty normal return, and it's somewhat close to the Specialty Retail industry average of 18%.
View our latest analysis for Beacon Lighting Group
Above you can see how the current ROCE for Beacon Lighting Group compares to its prior returns on capital, but there's only so much you can tell from the past. If you're interested, you can view the analysts predictions in our free analyst report for Beacon Lighting Group .
The Trend Of ROCE
On the surface, the trend of ROCE at Beacon Lighting Group doesn't inspire confidence. To be more specific, ROCE has fallen from 32% over the last five years. Meanwhile, the business is utilizing more capital but this hasn't moved the needle much in terms of sales in the past 12 months, so this could reflect longer term investments. It may take some time before the company starts to see any change in earnings from these investments.
On a side note, Beacon Lighting Group has done well to pay down its current liabilities to 25% of total assets. So we could link some of this to the decrease in ROCE. What's more, this can reduce some aspects of risk to the business because now the company's suppliers or short-term creditors are funding less of its operations. Some would claim this reduces the business' efficiency at generating ROCE since it is now funding more of the operations with its own money.
In Conclusion...
To conclude, we've found that Beacon Lighting Group is reinvesting in the business, but returns have been falling. Investors must think there's better things to come because the stock has knocked it out of the park, delivering a 234% gain to shareholders who have held over the last five years. But if the trajectory of these underlying trends continue, we think the likelihood of it being a multi-bagger from here isn't high.
One more thing to note, we've identified 1 warning sign with Beacon Lighting Group and understanding this should be part of your investment process.
For those who like to invest in solid companies, check out this free list of companies with solid balance sheets and high returns on equity.
Have feedback on this article? Concerned about the content? Get in touch with us directly. Alternatively, email editorial-team (at) simplywallst.com.
This article by Simply Wall St is general in nature. We provide commentary based on historical data and analyst forecasts only using an unbiased methodology and our articles are not intended to be financial advice. It does not constitute a recommendation to buy or sell any stock, and does not take account of your objectives, or your financial situation. We aim to bring you long-term focused analysis driven by fundamental data. Note that our analysis may not factor in the latest price-sensitive company announcements or qualitative material. Simply Wall St has no position in any stocks mentioned.
