
 Yahoo Finance
 Returns on Capital Paint A Bright Future For ChampionX (NASDAQ:CHX)
Finding a business that has the potential to grow substantially is not easy, but it is possible if we look at a few key financial metrics. One common approach is to try and find a company with returns on capital employed (ROCE) that are increasing, in conjunction with a growing amount of capital employed. This shows us that it's a compounding machine, able to continually reinvest its earnings back into the business and generate higher returns. Speaking of which, we noticed some great changes in ChampionX's (NASDAQ:CHX) returns on capital, so let's have a look.
Return On Capital Employed (ROCE): What Is It?
For those that aren't sure what ROCE is, it measures the amount of pre-tax profits a company can generate from the capital employed in its business. To calculate this metric for ChampionX, this is the formula:
Return on Capital Employed = Earnings Before Interest and Tax (EBIT) ÷ (Total Assets - Current Liabilities)
0.21 = US$513m ÷ (US$3.2b - US$783m) (Based on the trailing twelve months to December 2023).
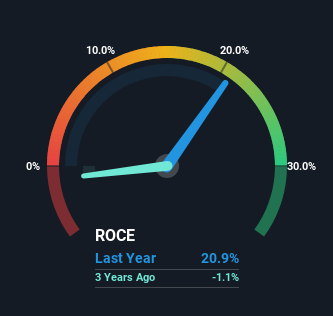
Therefore, ChampionX has an ROCE of 21%. That's a fantastic return and not only that, it outpaces the average of 12% earned by companies in a similar industry.
See our latest analysis for ChampionX
In the above chart we have measured ChampionX's prior ROCE against its prior performance, but the future is arguably more important. If you'd like to see what analysts are forecasting going forward, you should check out our free analyst report for ChampionX .
What Can We Tell From ChampionX's ROCE Trend?
The trends we've noticed at ChampionX are quite reassuring. The data shows that returns on capital have increased substantially over the last five years to 21%. Basically the business is earning more per dollar of capital invested and in addition to that, 40% more capital is being employed now too. This can indicate that there's plenty of opportunities to invest capital internally and at ever higher rates, a combination that's common among multi-baggers.
On a side note, we noticed that the improvement in ROCE appears to be partly fueled by an increase in current liabilities. Effectively this means that suppliers or short-term creditors are now funding 24% of the business, which is more than it was five years ago. It's worth keeping an eye on this because as the percentage of current liabilities to total assets increases, some aspects of risk also increase.
In Conclusion...
All in all, it's terrific to see that ChampionX is reaping the rewards from prior investments and is growing its capital base. Given the stock has declined 22% in the last five years, this could be a good investment if the valuation and other metrics are also appealing. So researching this company further and determining whether or not these trends will continue seems justified.
While ChampionX looks impressive, no company is worth an infinite price. The intrinsic value infographic for CHX helps visualize whether it is currently trading for a fair price.
ChampionX is not the only stock earning high returns. If you'd like to see more, check out our free list of companies earning high returns on equity with solid fundamentals.
Have feedback on this article? Concerned about the content? Get in touch with us directly. Alternatively, email editorial-team (at) simplywallst.com.
This article by Simply Wall St is general in nature. We provide commentary based on historical data and analyst forecasts only using an unbiased methodology and our articles are not intended to be financial advice. It does not constitute a recommendation to buy or sell any stock, and does not take account of your objectives, or your financial situation. We aim to bring you long-term focused analysis driven by fundamental data. Note that our analysis may not factor in the latest price-sensitive company announcements or qualitative material. Simply Wall St has no position in any stocks mentioned.
