
 Yahoo Finance
 Returns On Capital At Macquarie Telecom Group (ASX:MAQ) Paint A Concerning Picture
To find a multi-bagger stock, what are the underlying trends we should look for in a business? Ideally, a business will show two trends; firstly a growing return on capital employed (ROCE) and secondly, an increasing amount of capital employed. Basically this means that a company has profitable initiatives that it can continue to reinvest in, which is a trait of a compounding machine. Although, when we looked at Macquarie Telecom Group (ASX:MAQ), it didn't seem to tick all of these boxes.
Return On Capital Employed (ROCE): What is it?
For those who don't know, ROCE is a measure of a company's yearly pre-tax profit (its return), relative to the capital employed in the business. To calculate this metric for Macquarie Telecom Group, this is the formula:
Return on Capital Employed = Earnings Before Interest and Tax (EBIT) ÷ (Total Assets - Current Liabilities)
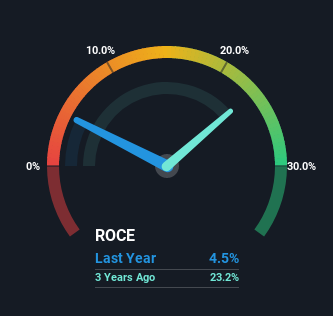
0.045 = AU$19m ÷ (AU$478m - AU$59m) (Based on the trailing twelve months to December 2021).
So, Macquarie Telecom Group has an ROCE of 4.5%. In absolute terms, that's a low return, but it's much better than the Telecom industry average of 3.4%.
View our latest analysis for Macquarie Telecom Group
In the above chart we have measured Macquarie Telecom Group's prior ROCE against its prior performance, but the future is arguably more important. If you're interested, you can view the analysts predictions in our free report on analyst forecasts for the company.
So How Is Macquarie Telecom Group's ROCE Trending?
In terms of Macquarie Telecom Group's historical ROCE movements, the trend isn't fantastic. Over the last five years, returns on capital have decreased to 4.5% from 14% five years ago. However it looks like Macquarie Telecom Group might be reinvesting for long term growth because while capital employed has increased, the company's sales haven't changed much in the last 12 months. It's worth keeping an eye on the company's earnings from here on to see if these investments do end up contributing to the bottom line.
On a side note, Macquarie Telecom Group has done well to pay down its current liabilities to 12% of total assets. So we could link some of this to the decrease in ROCE. Effectively this means their suppliers or short-term creditors are funding less of the business, which reduces some elements of risk. Some would claim this reduces the business' efficiency at generating ROCE since it is now funding more of the operations with its own money.
The Bottom Line On Macquarie Telecom Group's ROCE
To conclude, we've found that Macquarie Telecom Group is reinvesting in the business, but returns have been falling. Investors must think there's better things to come because the stock has knocked it out of the park, delivering a 463% gain to shareholders who have held over the last five years. Ultimately, if the underlying trends persist, we wouldn't hold our breath on it being a multi-bagger going forward.
Like most companies, Macquarie Telecom Group does come with some risks, and we've found 2 warning signs that you should be aware of.
While Macquarie Telecom Group may not currently earn the highest returns, we've compiled a list of companies that currently earn more than 25% return on equity. Check out this free list here.
Have feedback on this article? Concerned about the content? Get in touch with us directly. Alternatively, email editorial-team (at) simplywallst.com.
This article by Simply Wall St is general in nature. We provide commentary based on historical data and analyst forecasts only using an unbiased methodology and our articles are not intended to be financial advice. It does not constitute a recommendation to buy or sell any stock, and does not take account of your objectives, or your financial situation. We aim to bring you long-term focused analysis driven by fundamental data. Note that our analysis may not factor in the latest price-sensitive company announcements or qualitative material. Simply Wall St has no position in any stocks mentioned.
