
 Yahoo Finance
 Returns On Capital At La-Z-Boy (NYSE:LZB) Have Hit The Brakes
If you're looking for a multi-bagger, there's a few things to keep an eye out for. Typically, we'll want to notice a trend of growing return on capital employed (ROCE) and alongside that, an expanding base of capital employed. This shows us that it's a compounding machine, able to continually reinvest its earnings back into the business and generate higher returns. That's why when we briefly looked at La-Z-Boy's (NYSE:LZB) ROCE trend, we were pretty happy with what we saw.
Return On Capital Employed (ROCE): What Is It?
For those that aren't sure what ROCE is, it measures the amount of pre-tax profits a company can generate from the capital employed in its business. Analysts use this formula to calculate it for La-Z-Boy:
Return on Capital Employed = Earnings Before Interest and Tax (EBIT) ÷ (Total Assets - Current Liabilities)
0.18 = US$226m ÷ (US$1.9b - US$639m) (Based on the trailing twelve months to July 2022).
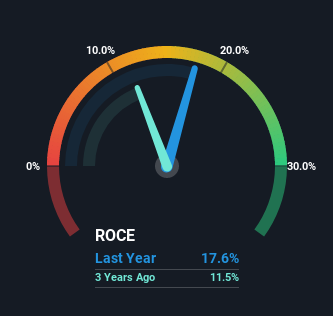
Therefore, La-Z-Boy has an ROCE of 18%. In absolute terms, that's a pretty normal return, and it's somewhat close to the Consumer Durables industry average of 17%.
See our latest analysis for La-Z-Boy
In the above chart we have measured La-Z-Boy's prior ROCE against its prior performance, but the future is arguably more important. If you're interested, you can view the analysts predictions in our free report on analyst forecasts for the company.
What Can We Tell From La-Z-Boy's ROCE Trend?
The trend of ROCE doesn't stand out much, but returns on a whole are decent. Over the past five years, ROCE has remained relatively flat at around 18% and the business has deployed 84% more capital into its operations. 18% is a pretty standard return, and it provides some comfort knowing that La-Z-Boy has consistently earned this amount. Stable returns in this ballpark can be unexciting, but if they can be maintained over the long run, they often provide nice rewards to shareholders.
On another note, while the change in ROCE trend might not scream for attention, it's interesting that the current liabilities have actually gone up over the last five years. This is intriguing because if current liabilities hadn't increased to 33% of total assets, this reported ROCE would probably be less than18% because total capital employed would be higher.The 18% ROCE could be even lower if current liabilities weren't 33% of total assets, because the the formula would show a larger base of total capital employed. With that in mind, just be wary if this ratio increases in the future, because if it gets particularly high, this brings with it some new elements of risk.
Our Take On La-Z-Boy's ROCE
The main thing to remember is that La-Z-Boy has proven its ability to continually reinvest at respectable rates of return. Despite the good fundamentals, total returns from the stock have been virtually flat over the last five years. That's why we think it'd be worthwhile to look further into this stock given the fundamentals are appealing.
Since virtually every company faces some risks, it's worth knowing what they are, and we've spotted 2 warning signs for La-Z-Boy (of which 1 is significant!) that you should know about.
If you want to search for solid companies with great earnings, check out this free list of companies with good balance sheets and impressive returns on equity.
Have feedback on this article? Concerned about the content? Get in touch with us directly. Alternatively, email editorial-team (at) simplywallst.com.
This article by Simply Wall St is general in nature. We provide commentary based on historical data and analyst forecasts only using an unbiased methodology and our articles are not intended to be financial advice. It does not constitute a recommendation to buy or sell any stock, and does not take account of your objectives, or your financial situation. We aim to bring you long-term focused analysis driven by fundamental data. Note that our analysis may not factor in the latest price-sensitive company announcements or qualitative material. Simply Wall St has no position in any stocks mentioned.
Join A Paid User Research Session
You’ll receive a US$30 Amazon Gift card for 1 hour of your time while helping us build better investing tools for the individual investors like yourself. Sign up here
