
 Yahoo Finance
 Returns On Capital At Elders (ASX:ELD) Paint A Concerning Picture
There are a few key trends to look for if we want to identify the next multi-bagger. Firstly, we'll want to see a proven return on capital employed (ROCE) that is increasing, and secondly, an expanding base of capital employed. Ultimately, this demonstrates that it's a business that is reinvesting profits at increasing rates of return. In light of that, when we looked at Elders (ASX:ELD) and its ROCE trend, we weren't exactly thrilled.
Understanding Return On Capital Employed (ROCE)
If you haven't worked with ROCE before, it measures the 'return' (pre-tax profit) a company generates from capital employed in its business. Analysts use this formula to calculate it for Elders:
Return on Capital Employed = Earnings Before Interest and Tax (EBIT) ÷ (Total Assets - Current Liabilities)
0.15 = AU$157m ÷ (AU$2.1b - AU$1.0b) (Based on the trailing twelve months to September 2023).
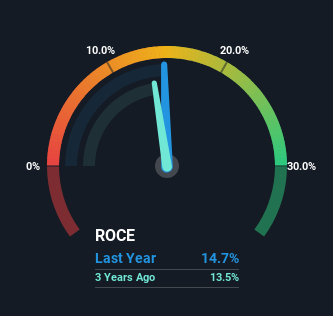
So, Elders has an ROCE of 15%. In absolute terms, that's a satisfactory return, but compared to the Food industry average of 6.2% it's much better.
View our latest analysis for Elders
Above you can see how the current ROCE for Elders compares to its prior returns on capital, but there's only so much you can tell from the past. If you'd like to see what analysts are forecasting going forward, you should check out our free report for Elders.
How Are Returns Trending?
When we looked at the ROCE trend at Elders, we didn't gain much confidence. Around five years ago the returns on capital were 21%, but since then they've fallen to 15%. Meanwhile, the business is utilizing more capital but this hasn't moved the needle much in terms of sales in the past 12 months, so this could reflect longer term investments. It may take some time before the company starts to see any change in earnings from these investments.
On a related note, Elders has decreased its current liabilities to 49% of total assets. So we could link some of this to the decrease in ROCE. Effectively this means their suppliers or short-term creditors are funding less of the business, which reduces some elements of risk. Some would claim this reduces the business' efficiency at generating ROCE since it is now funding more of the operations with its own money. Keep in mind 49% is still pretty high, so those risks are still somewhat prevalent.
The Bottom Line On Elders' ROCE
To conclude, we've found that Elders is reinvesting in the business, but returns have been falling. Although the market must be expecting these trends to improve because the stock has gained 48% over the last five years. Ultimately, if the underlying trends persist, we wouldn't hold our breath on it being a multi-bagger going forward.
Elders does have some risks though, and we've spotted 2 warning signs for Elders that you might be interested in.
While Elders isn't earning the highest return, check out this free list of companies that are earning high returns on equity with solid balance sheets.
Have feedback on this article? Concerned about the content? Get in touch with us directly. Alternatively, email editorial-team (at) simplywallst.com.
This article by Simply Wall St is general in nature. We provide commentary based on historical data and analyst forecasts only using an unbiased methodology and our articles are not intended to be financial advice. It does not constitute a recommendation to buy or sell any stock, and does not take account of your objectives, or your financial situation. We aim to bring you long-term focused analysis driven by fundamental data. Note that our analysis may not factor in the latest price-sensitive company announcements or qualitative material. Simply Wall St has no position in any stocks mentioned.
