
 Yahoo Finance
 Return Trends At Smarttech247 Group (LON:S247) Aren't Appealing
Finding a business that has the potential to grow substantially is not easy, but it is possible if we look at a few key financial metrics. In a perfect world, we'd like to see a company investing more capital into its business and ideally the returns earned from that capital are also increasing. Ultimately, this demonstrates that it's a business that is reinvesting profits at increasing rates of return. With that in mind, the ROCE of Smarttech247 Group (LON:S247) looks decent, right now, so lets see what the trend of returns can tell us.
Understanding Return On Capital Employed (ROCE)
For those who don't know, ROCE is a measure of a company's yearly pre-tax profit (its return), relative to the capital employed in the business. The formula for this calculation on Smarttech247 Group is:
Return on Capital Employed = Earnings Before Interest and Tax (EBIT) ÷ (Total Assets - Current Liabilities)
0.14 = €1.6m ÷ (€18m - €6.3m) (Based on the trailing twelve months to July 2023).
Therefore, Smarttech247 Group has an ROCE of 14%. On its own, that's a standard return, however it's much better than the 8.7% generated by the Software industry.
See our latest analysis for Smarttech247 Group
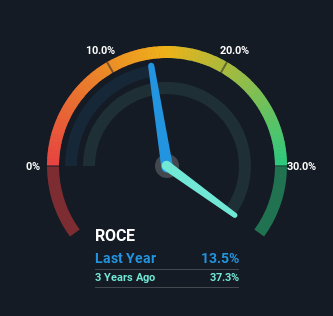
Historical performance is a great place to start when researching a stock so above you can see the gauge for Smarttech247 Group's ROCE against it's prior returns. If you're interested in investigating Smarttech247 Group's past further, check out this free graph of past earnings, revenue and cash flow.
What The Trend Of ROCE Can Tell Us
While the returns on capital are good, they haven't moved much. Over the past four years, ROCE has remained relatively flat at around 14% and the business has deployed 598% more capital into its operations. 14% is a pretty standard return, and it provides some comfort knowing that Smarttech247 Group has consistently earned this amount. Over long periods of time, returns like these might not be too exciting, but with consistency they can pay off in terms of share price returns.
What We Can Learn From Smarttech247 Group's ROCE
In the end, Smarttech247 Group has proven its ability to adequately reinvest capital at good rates of return. However, despite the favorable fundamentals, the stock has fallen 32% over the last year, so there might be an opportunity here for astute investors. That's why we think it'd be worthwhile to look further into this stock given the fundamentals are appealing.
On a final note, we found 2 warning signs for Smarttech247 Group (1 doesn't sit too well with us) you should be aware of.
While Smarttech247 Group may not currently earn the highest returns, we've compiled a list of companies that currently earn more than 25% return on equity. Check out this free list here.
Have feedback on this article? Concerned about the content? Get in touch with us directly. Alternatively, email editorial-team (at) simplywallst.com.
This article by Simply Wall St is general in nature. We provide commentary based on historical data and analyst forecasts only using an unbiased methodology and our articles are not intended to be financial advice. It does not constitute a recommendation to buy or sell any stock, and does not take account of your objectives, or your financial situation. We aim to bring you long-term focused analysis driven by fundamental data. Note that our analysis may not factor in the latest price-sensitive company announcements or qualitative material. Simply Wall St has no position in any stocks mentioned.
