
 Yahoo Finance
 The Return Trends At Patterson Companies (NASDAQ:PDCO) Look Promising
If you're not sure where to start when looking for the next multi-bagger, there are a few key trends you should keep an eye out for. Firstly, we'll want to see a proven return on capital employed (ROCE) that is increasing, and secondly, an expanding base of capital employed. Basically this means that a company has profitable initiatives that it can continue to reinvest in, which is a trait of a compounding machine. With that in mind, we've noticed some promising trends at Patterson Companies (NASDAQ:PDCO) so let's look a bit deeper.
What Is Return On Capital Employed (ROCE)?
For those who don't know, ROCE is a measure of a company's yearly pre-tax profit (its return), relative to the capital employed in the business. The formula for this calculation on Patterson Companies is:
Return on Capital Employed = Earnings Before Interest and Tax (EBIT) ÷ (Total Assets - Current Liabilities)
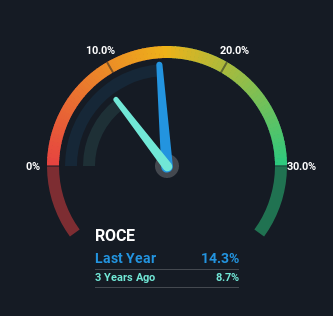
0.14 = US$253m ÷ (US$2.9b - US$1.2b) (Based on the trailing twelve months to January 2023).
Thus, Patterson Companies has an ROCE of 14%. In absolute terms, that's a satisfactory return, but compared to the Healthcare industry average of 9.4% it's much better.
See our latest analysis for Patterson Companies
Above you can see how the current ROCE for Patterson Companies compares to its prior returns on capital, but there's only so much you can tell from the past. If you're interested, you can view the analysts predictions in our free report on analyst forecasts for the company.
What Does the ROCE Trend For Patterson Companies Tell Us?
We're pretty happy with how the ROCE has been trending at Patterson Companies. The data shows that returns on capital have increased by 34% over the trailing five years. That's not bad because this tells for every dollar invested (capital employed), the company is increasing the amount earned from that dollar. Speaking of capital employed, the company is actually utilizing 31% less than it was five years ago, which can be indicative of a business that's improving its efficiency. Patterson Companies may be selling some assets so it's worth investigating if the business has plans for future investments to increase returns further still.
In Conclusion...
In the end, Patterson Companies has proven it's capital allocation skills are good with those higher returns from less amount of capital. Since the stock has only returned 39% to shareholders over the last five years, the promising fundamentals may not be recognized yet by investors. So with that in mind, we think the stock deserves further research.
If you'd like to know more about Patterson Companies, we've spotted 3 warning signs, and 2 of them are concerning.
While Patterson Companies may not currently earn the highest returns, we've compiled a list of companies that currently earn more than 25% return on equity. Check out this free list here.
Have feedback on this article? Concerned about the content? Get in touch with us directly. Alternatively, email editorial-team (at) simplywallst.com.
This article by Simply Wall St is general in nature. We provide commentary based on historical data and analyst forecasts only using an unbiased methodology and our articles are not intended to be financial advice. It does not constitute a recommendation to buy or sell any stock, and does not take account of your objectives, or your financial situation. We aim to bring you long-term focused analysis driven by fundamental data. Note that our analysis may not factor in the latest price-sensitive company announcements or qualitative material. Simply Wall St has no position in any stocks mentioned.
Join A Paid User Research Session
You’ll receive a US$30 Amazon Gift card for 1 hour of your time while helping us build better investing tools for the individual investors like yourself. Sign up here
