
 Yahoo Finance
 The Return Trends At Natural Cool Holdings (Catalist:5IF) Look Promising
If we want to find a potential multi-bagger, often there are underlying trends that can provide clues. In a perfect world, we'd like to see a company investing more capital into its business and ideally the returns earned from that capital are also increasing. Basically this means that a company has profitable initiatives that it can continue to reinvest in, which is a trait of a compounding machine. Speaking of which, we noticed some great changes in Natural Cool Holdings' (Catalist:5IF) returns on capital, so let's have a look.
Understanding Return On Capital Employed (ROCE)
For those that aren't sure what ROCE is, it measures the amount of pre-tax profits a company can generate from the capital employed in its business. Analysts use this formula to calculate it for Natural Cool Holdings:
Return on Capital Employed = Earnings Before Interest and Tax (EBIT) ÷ (Total Assets - Current Liabilities)
0.021 = S$961k ÷ (S$94m - S$48m) (Based on the trailing twelve months to June 2023).
Therefore, Natural Cool Holdings has an ROCE of 2.1%. Ultimately, that's a low return and it under-performs the Commercial Services industry average of 6.7%.
Check out our latest analysis for Natural Cool Holdings
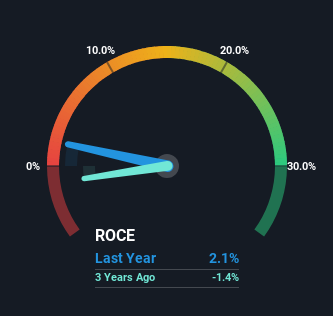
Historical performance is a great place to start when researching a stock so above you can see the gauge for Natural Cool Holdings' ROCE against it's prior returns. If you're interested in investigating Natural Cool Holdings' past further, check out this free graph of past earnings, revenue and cash flow.
The Trend Of ROCE
Shareholders will be relieved that Natural Cool Holdings has broken into profitability. The company now earns 2.1% on its capital, because five years ago it was incurring losses. While returns have increased, the amount of capital employed by Natural Cool Holdings has remained flat over the period. That being said, while an increase in efficiency is no doubt appealing, it'd be helpful to know if the company does have any investment plans going forward. After all, a company can only become a long term multi-bagger if it continually reinvests in itself at high rates of return.
Another thing to note, Natural Cool Holdings has a high ratio of current liabilities to total assets of 51%. This can bring about some risks because the company is basically operating with a rather large reliance on its suppliers or other sorts of short-term creditors. While it's not necessarily a bad thing, it can be beneficial if this ratio is lower.
The Bottom Line
To sum it up, Natural Cool Holdings is collecting higher returns from the same amount of capital, and that's impressive. Astute investors may have an opportunity here because the stock has declined 66% in the last five years. That being the case, research into the company's current valuation metrics and future prospects seems fitting.
One more thing, we've spotted 2 warning signs facing Natural Cool Holdings that you might find interesting.
While Natural Cool Holdings may not currently earn the highest returns, we've compiled a list of companies that currently earn more than 25% return on equity. Check out this free list here.
Have feedback on this article? Concerned about the content? Get in touch with us directly. Alternatively, email editorial-team (at) simplywallst.com.
This article by Simply Wall St is general in nature. We provide commentary based on historical data and analyst forecasts only using an unbiased methodology and our articles are not intended to be financial advice. It does not constitute a recommendation to buy or sell any stock, and does not take account of your objectives, or your financial situation. We aim to bring you long-term focused analysis driven by fundamental data. Note that our analysis may not factor in the latest price-sensitive company announcements or qualitative material. Simply Wall St has no position in any stocks mentioned.
