
 Yahoo Finance
 The Return Trends At Greiffenberger (FRA:GRF) Look Promising
To find a multi-bagger stock, what are the underlying trends we should look for in a business? Amongst other things, we'll want to see two things; firstly, a growing return on capital employed (ROCE) and secondly, an expansion in the company's amount of capital employed. Put simply, these types of businesses are compounding machines, meaning they are continually reinvesting their earnings at ever-higher rates of return. So on that note, Greiffenberger (FRA:GRF) looks quite promising in regards to its trends of return on capital.
Return On Capital Employed (ROCE): What Is It?
If you haven't worked with ROCE before, it measures the 'return' (pre-tax profit) a company generates from capital employed in its business. To calculate this metric for Greiffenberger, this is the formula:
Return on Capital Employed = Earnings Before Interest and Tax (EBIT) ÷ (Total Assets - Current Liabilities)
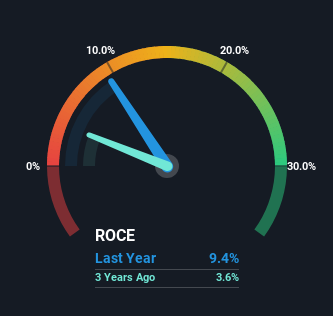
0.094 = €4.4m ÷ (€59m - €13m) (Based on the trailing twelve months to December 2022).
So, Greiffenberger has an ROCE of 9.4%. In absolute terms, that's a low return but it's around the Machinery industry average of 11%.
Check out our latest analysis for Greiffenberger
While the past is not representative of the future, it can be helpful to know how a company has performed historically, which is why we have this chart above. If you want to delve into the historical earnings, revenue and cash flow of Greiffenberger, check out these free graphs here.
The Trend Of ROCE
Even though ROCE is still low in absolute terms, it's good to see it's heading in the right direction. Over the last five years, returns on capital employed have risen substantially to 9.4%. The amount of capital employed has increased too, by 33%. So we're very much inspired by what we're seeing at Greiffenberger thanks to its ability to profitably reinvest capital.
Our Take On Greiffenberger's ROCE
To sum it up, Greiffenberger has proven it can reinvest in the business and generate higher returns on that capital employed, which is terrific. And investors seem to expect more of this going forward, since the stock has rewarded shareholders with a 76% return over the last five years. With that being said, we still think the promising fundamentals mean the company deserves some further due diligence.
Greiffenberger does have some risks, we noticed 3 warning signs (and 1 which shouldn't be ignored) we think you should know about.
While Greiffenberger isn't earning the highest return, check out this free list of companies that are earning high returns on equity with solid balance sheets.
Have feedback on this article? Concerned about the content? Get in touch with us directly. Alternatively, email editorial-team (at) simplywallst.com.
This article by Simply Wall St is general in nature. We provide commentary based on historical data and analyst forecasts only using an unbiased methodology and our articles are not intended to be financial advice. It does not constitute a recommendation to buy or sell any stock, and does not take account of your objectives, or your financial situation. We aim to bring you long-term focused analysis driven by fundamental data. Note that our analysis may not factor in the latest price-sensitive company announcements or qualitative material. Simply Wall St has no position in any stocks mentioned.
