
 Yahoo Finance
 The Return Trends At Advance ZincTek (ASX:ANO) Look Promising
Finding a business that has the potential to grow substantially is not easy, but it is possible if we look at a few key financial metrics. One common approach is to try and find a company with returns on capital employed (ROCE) that are increasing, in conjunction with a growing amount of capital employed. Ultimately, this demonstrates that it's a business that is reinvesting profits at increasing rates of return. Speaking of which, we noticed some great changes in Advance ZincTek's (ASX:ANO) returns on capital, so let's have a look.
Return On Capital Employed (ROCE): What is it?
Just to clarify if you're unsure, ROCE is a metric for evaluating how much pre-tax income (in percentage terms) a company earns on the capital invested in its business. The formula for this calculation on Advance ZincTek is:
Return on Capital Employed = Earnings Before Interest and Tax (EBIT) ÷ (Total Assets - Current Liabilities)
0.022 = AU$670k ÷ (AU$34m - AU$3.9m) (Based on the trailing twelve months to June 2021).
So, Advance ZincTek has an ROCE of 2.2%. In absolute terms, that's a low return and it also under-performs the Chemicals industry average of 5.4%.
See our latest analysis for Advance ZincTek
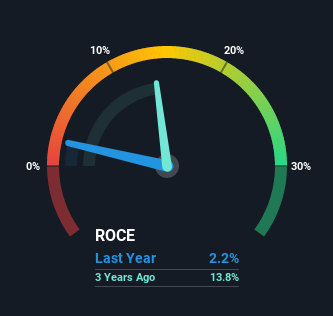
Historical performance is a great place to start when researching a stock so above you can see the gauge for Advance ZincTek's ROCE against it's prior returns. If you want to delve into the historical earnings, revenue and cash flow of Advance ZincTek, check out these free graphs here.
What Can We Tell From Advance ZincTek's ROCE Trend?
We're delighted to see that Advance ZincTek is reaping rewards from its investments and is now generating some pre-tax profits. Shareholders would no doubt be pleased with this because the business was loss-making five years ago but is is now generating 2.2% on its capital. In addition to that, Advance ZincTek is employing 551% more capital than previously which is expected of a company that's trying to break into profitability. We like this trend, because it tells us the company has profitable reinvestment opportunities available to it, and if it continues going forward that can lead to a multi-bagger performance.
The Bottom Line On Advance ZincTek's ROCE
Long story short, we're delighted to see that Advance ZincTek's reinvestment activities have paid off and the company is now profitable. And a remarkable 1,130% total return over the last five years tells us that investors are expecting more good things to come in the future. Therefore, we think it would be worth your time to check if these trends are going to continue.
If you'd like to know about the risks facing Advance ZincTek, we've discovered 2 warning signs that you should be aware of.
If you want to search for solid companies with great earnings, check out this free list of companies with good balance sheets and impressive returns on equity.
Have feedback on this article? Concerned about the content? Get in touch with us directly. Alternatively, email editorial-team (at) simplywallst.com.
This article by Simply Wall St is general in nature. We provide commentary based on historical data and analyst forecasts only using an unbiased methodology and our articles are not intended to be financial advice. It does not constitute a recommendation to buy or sell any stock, and does not take account of your objectives, or your financial situation. We aim to bring you long-term focused analysis driven by fundamental data. Note that our analysis may not factor in the latest price-sensitive company announcements or qualitative material. Simply Wall St has no position in any stocks mentioned.
