
 Yahoo Finance
 With A Return On Equity Of 9.7%, Has Exchange Income Corporation's (TSE:EIF) Management Done Well?
While some investors are already well versed in financial metrics (hat tip), this article is for those who would like to learn about Return On Equity (ROE) and why it is important. We'll use ROE to examine Exchange Income Corporation (TSE:EIF), by way of a worked example.
Return on Equity or ROE is a test of how effectively a company is growing its value and managing investors’ money. In simpler terms, it measures the profitability of a company in relation to shareholder's equity.
Check out our latest analysis for Exchange Income
How To Calculate Return On Equity?
Return on equity can be calculated by using the formula:
Return on Equity = Net Profit (from continuing operations) ÷ Shareholders' Equity
So, based on the above formula, the ROE for Exchange Income is:
9.7% = CA$120m ÷ CA$1.2b (Based on the trailing twelve months to March 2024).
The 'return' is the yearly profit. Another way to think of that is that for every CA$1 worth of equity, the company was able to earn CA$0.10 in profit.
Does Exchange Income Have A Good Return On Equity?
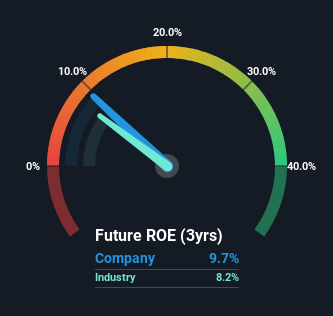
Arguably the easiest way to assess company's ROE is to compare it with the average in its industry. The limitation of this approach is that some companies are quite different from others, even within the same industry classification. You can see in the graphic below that Exchange Income has an ROE that is fairly close to the average for the Airlines industry (8.2%).
That's neither particularly good, nor bad. Although the ROE is similar to the industry, we should still perform further checks to see if the company's ROE is being boosted by high debt levels. If a company takes on too much debt, it is at higher risk of defaulting on interest payments. Our risks dashboardshould have the 3 risks we have identified for Exchange Income.
How Does Debt Impact Return On Equity?
Companies usually need to invest money to grow their profits. That cash can come from issuing shares, retained earnings, or debt. In the first two cases, the ROE will capture this use of capital to grow. In the latter case, the debt used for growth will improve returns, but won't affect the total equity. That will make the ROE look better than if no debt was used.
Combining Exchange Income's Debt And Its 9.7% Return On Equity
Exchange Income does use a high amount of debt to increase returns. It has a debt to equity ratio of 1.51. Its ROE is quite low, even with the use of significant debt; that's not a good result, in our opinion. Debt does bring extra risk, so it's only really worthwhile when a company generates some decent returns from it.
Summary
Return on equity is a useful indicator of the ability of a business to generate profits and return them to shareholders. A company that can achieve a high return on equity without debt could be considered a high quality business. All else being equal, a higher ROE is better.
Having said that, while ROE is a useful indicator of business quality, you'll have to look at a whole range of factors to determine the right price to buy a stock. The rate at which profits are likely to grow, relative to the expectations of profit growth reflected in the current price, must be considered, too. So I think it may be worth checking this free report on analyst forecasts for the company.
If you would prefer check out another company -- one with potentially superior financials -- then do not miss this free list of interesting companies, that have HIGH return on equity and low debt.
Have feedback on this article? Concerned about the content? Get in touch with us directly. Alternatively, email editorial-team (at) simplywallst.com.
This article by Simply Wall St is general in nature. We provide commentary based on historical data and analyst forecasts only using an unbiased methodology and our articles are not intended to be financial advice. It does not constitute a recommendation to buy or sell any stock, and does not take account of your objectives, or your financial situation. We aim to bring you long-term focused analysis driven by fundamental data. Note that our analysis may not factor in the latest price-sensitive company announcements or qualitative material. Simply Wall St has no position in any stocks mentioned.