
 Yahoo Finance
 Retech Technology's (ASX:RTE) Returns On Capital Not Reflecting Well On The Business
To find a multi-bagger stock, what are the underlying trends we should look for in a business? One common approach is to try and find a company with returns on capital employed (ROCE) that are increasing, in conjunction with a growing amount of capital employed. Put simply, these types of businesses are compounding machines, meaning they are continually reinvesting their earnings at ever-higher rates of return. Having said that, from a first glance at Retech Technology (ASX:RTE) we aren't jumping out of our chairs at how returns are trending, but let's have a deeper look.
What is Return On Capital Employed (ROCE)?
If you haven't worked with ROCE before, it measures the 'return' (pre-tax profit) a company generates from capital employed in its business. To calculate this metric for Retech Technology, this is the formula:
Return on Capital Employed = Earnings Before Interest and Tax (EBIT) ÷ (Total Assets - Current Liabilities)
0.14 = CN¥52m ÷ (CN¥578m - CN¥216m) (Based on the trailing twelve months to June 2021).
Thus, Retech Technology has an ROCE of 14%. In absolute terms, that's a satisfactory return, but compared to the Consumer Services industry average of 8.9% it's much better.
View our latest analysis for Retech Technology
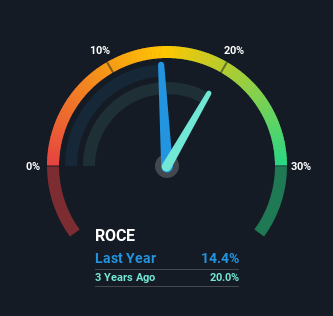
Historical performance is a great place to start when researching a stock so above you can see the gauge for Retech Technology's ROCE against it's prior returns. If you're interested in investigating Retech Technology's past further, check out this free graph of past earnings, revenue and cash flow.
So How Is Retech Technology's ROCE Trending?
In terms of Retech Technology's historical ROCE movements, the trend isn't fantastic. Around four years ago the returns on capital were 28%, but since then they've fallen to 14%. Although, given both revenue and the amount of assets employed in the business have increased, it could suggest the company is investing in growth, and the extra capital has led to a short-term reduction in ROCE. If these investments prove successful, this can bode very well for long term stock performance.
While on the subject, we noticed that the ratio of current liabilities to total assets has risen to 37%, which has impacted the ROCE. Without this increase, it's likely that ROCE would be even lower than 14%. While the ratio isn't currently too high, it's worth keeping an eye on this because if it gets particularly high, the business could then face some new elements of risk.
In Conclusion...
In summary, despite lower returns in the short term, we're encouraged to see that Retech Technology is reinvesting for growth and has higher sales as a result. These growth trends haven't led to growth returns though, since the stock has fallen 44% over the last three years. As a result, we'd recommend researching this stock further to uncover what other fundamentals of the business can show us.
If you want to know some of the risks facing Retech Technology we've found 2 warning signs (1 is concerning!) that you should be aware of before investing here.
For those who like to invest in solid companies, check out this free list of companies with solid balance sheets and high returns on equity.
Have feedback on this article? Concerned about the content? Get in touch with us directly. Alternatively, email editorial-team (at) simplywallst.com.
This article by Simply Wall St is general in nature. We provide commentary based on historical data and analyst forecasts only using an unbiased methodology and our articles are not intended to be financial advice. It does not constitute a recommendation to buy or sell any stock, and does not take account of your objectives, or your financial situation. We aim to bring you long-term focused analysis driven by fundamental data. Note that our analysis may not factor in the latest price-sensitive company announcements or qualitative material. Simply Wall St has no position in any stocks mentioned.
