
 Yahoo Finance
 Retail Food Group's (ASX:RFG) Returns On Capital Are Heading Higher
If we want to find a potential multi-bagger, often there are underlying trends that can provide clues. Ideally, a business will show two trends; firstly a growing return on capital employed (ROCE) and secondly, an increasing amount of capital employed. Basically this means that a company has profitable initiatives that it can continue to reinvest in, which is a trait of a compounding machine. So when we looked at Retail Food Group (ASX:RFG) and its trend of ROCE, we really liked what we saw.
Return On Capital Employed (ROCE): What Is It?
If you haven't worked with ROCE before, it measures the 'return' (pre-tax profit) a company generates from capital employed in its business. To calculate this metric for Retail Food Group, this is the formula:
Return on Capital Employed = Earnings Before Interest and Tax (EBIT) ÷ (Total Assets - Current Liabilities)
0.0097 = AU$3.0m ÷ (AU$363m - AU$59m) (Based on the trailing twelve months to December 2023).
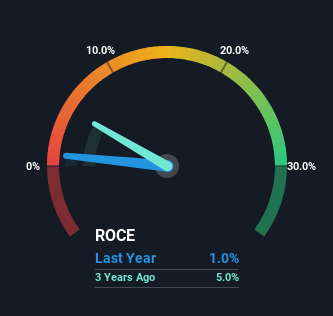
Thus, Retail Food Group has an ROCE of 1.0%. Ultimately, that's a low return and it under-performs the Hospitality industry average of 8.3%.
View our latest analysis for Retail Food Group
In the above chart we have measured Retail Food Group's prior ROCE against its prior performance, but the future is arguably more important. If you're interested, you can view the analysts predictions in our free analyst report for Retail Food Group .
So How Is Retail Food Group's ROCE Trending?
Retail Food Group has recently broken into profitability so their prior investments seem to be paying off. Shareholders would no doubt be pleased with this because the business was loss-making five years ago but is is now generating 1.0% on its capital. Not only that, but the company is utilizing 245% more capital than before, but that's to be expected from a company trying to break into profitability. This can tell us that the company has plenty of reinvestment opportunities that are able to generate higher returns.
On a related note, the company's ratio of current liabilities to total assets has decreased to 16%, which basically reduces it's funding from the likes of short-term creditors or suppliers. So shareholders would be pleased that the growth in returns has mostly come from underlying business performance.
The Bottom Line On Retail Food Group's ROCE
Overall, Retail Food Group gets a big tick from us thanks in most part to the fact that it is now profitable and is reinvesting in its business. Given the stock has declined 64% in the last five years, this could be a good investment if the valuation and other metrics are also appealing. That being the case, research into the company's current valuation metrics and future prospects seems fitting.
On the other side of ROCE, we have to consider valuation. That's why we have a FREE intrinsic value estimation for RFG on our platform that is definitely worth checking out.
While Retail Food Group may not currently earn the highest returns, we've compiled a list of companies that currently earn more than 25% return on equity. Check out this free list here.
Have feedback on this article? Concerned about the content? Get in touch with us directly. Alternatively, email editorial-team (at) simplywallst.com.
This article by Simply Wall St is general in nature. We provide commentary based on historical data and analyst forecasts only using an unbiased methodology and our articles are not intended to be financial advice. It does not constitute a recommendation to buy or sell any stock, and does not take account of your objectives, or your financial situation. We aim to bring you long-term focused analysis driven by fundamental data. Note that our analysis may not factor in the latest price-sensitive company announcements or qualitative material. Simply Wall St has no position in any stocks mentioned.
