
 Yahoo Finance
 Regis Resources (ASX:RRL) Could Be Struggling To Allocate Capital
If you're not sure where to start when looking for the next multi-bagger, there are a few key trends you should keep an eye out for. Amongst other things, we'll want to see two things; firstly, a growing return on capital employed (ROCE) and secondly, an expansion in the company's amount of capital employed. Basically this means that a company has profitable initiatives that it can continue to reinvest in, which is a trait of a compounding machine. Although, when we looked at Regis Resources (ASX:RRL), it didn't seem to tick all of these boxes.
Understanding Return On Capital Employed (ROCE)
For those that aren't sure what ROCE is, it measures the amount of pre-tax profits a company can generate from the capital employed in its business. Analysts use this formula to calculate it for Regis Resources:
Return on Capital Employed = Earnings Before Interest and Tax (EBIT) ÷ (Total Assets - Current Liabilities)
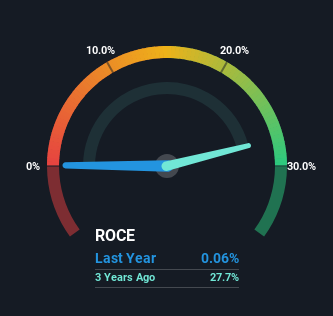
0.00062 = AU$1.2m ÷ (AU$2.4b - AU$442m) (Based on the trailing twelve months to June 2023).
Thus, Regis Resources has an ROCE of 0.06%. Ultimately, that's a low return and it under-performs the Metals and Mining industry average of 8.9%.
See our latest analysis for Regis Resources
Above you can see how the current ROCE for Regis Resources compares to its prior returns on capital, but there's only so much you can tell from the past. If you're interested, you can view the analysts predictions in our free report on analyst forecasts for the company.
The Trend Of ROCE
When we looked at the ROCE trend at Regis Resources, we didn't gain much confidence. To be more specific, ROCE has fallen from 33% over the last five years. Although, given both revenue and the amount of assets employed in the business have increased, it could suggest the company is investing in growth, and the extra capital has led to a short-term reduction in ROCE. If these investments prove successful, this can bode very well for long term stock performance.
On a side note, Regis Resources' current liabilities have increased over the last five years to 19% of total assets, effectively distorting the ROCE to some degree. Without this increase, it's likely that ROCE would be even lower than 0.06%. While the ratio isn't currently too high, it's worth keeping an eye on this because if it gets particularly high, the business could then face some new elements of risk.
What We Can Learn From Regis Resources' ROCE
Even though returns on capital have fallen in the short term, we find it promising that revenue and capital employed have both increased for Regis Resources. These growth trends haven't led to growth returns though, since the stock has fallen 55% over the last five years. As a result, we'd recommend researching this stock further to uncover what other fundamentals of the business can show us.
While Regis Resources doesn't shine too bright in this respect, it's still worth seeing if the company is trading at attractive prices. You can find that out with our FREE intrinsic value estimation on our platform.
For those who like to invest in solid companies, check out this free list of companies with solid balance sheets and high returns on equity.
Have feedback on this article? Concerned about the content? Get in touch with us directly. Alternatively, email editorial-team (at) simplywallst.com.
This article by Simply Wall St is general in nature. We provide commentary based on historical data and analyst forecasts only using an unbiased methodology and our articles are not intended to be financial advice. It does not constitute a recommendation to buy or sell any stock, and does not take account of your objectives, or your financial situation. We aim to bring you long-term focused analysis driven by fundamental data. Note that our analysis may not factor in the latest price-sensitive company announcements or qualitative material. Simply Wall St has no position in any stocks mentioned.
