
 Yahoo Finance
 Regency Centers (REG) Q1 FFO Beat Estimates, '24 View Revised
Regency Centers Corporation REG reported first-quarter 2024 NAREIT funds from operations (FFO) per share of $1.08, outpacing the Zacks Consensus Estimate of $1.04. The figure remained unchanged from the prior-year quarter.
Results reflect healthy leasing activity and a year-over-year improvement in the base rent. However, high interest expenses during the quarter acted as a dampener. The company also revised its 2024 outlook.
Total revenues of $363.9 million increased 14.4% from the year-ago period. However, the figure lagged the Zacks Consensus Estimate of $370 million.
Behind the Headlines
In the first quarter, Regency Centers executed approximately 1.8 million square feet of comparable new and renewal leases at a blended cash rent spread of 8.5%.
As of Mar 31, 2024, REG’s Same Property portfolio was 95.8% leased, reflecting an expansion of 20 basis points (bps) sequentially and 90 bps year over year.
The Same Property anchor percent leased (includes spaces greater than or equal to 10,000 square feet) was 97.2%, which increased 30 bps sequentially and 50 bps year over year.
The Same Property shop percent leased (includes spaces less than 10,000 square feet) was 93.5%, which rose 10 bps sequentially and 150 bps year over year.
The Same Property net operating income (NOI), excluding lease termination fees, increased 1.4% on a year-over-year basis to $235.1 million. Same Property base rents contributed 2.7% to same-property NOI growth in the quarter.
As of Mar 31, 2024, Regency Centers’ in-process development and redevelopment projects estimated net project costs of around $547 million at the company’s share. So far, it has incurred 46% of the cost.
Balance Sheet
The company ended the first quarter of 2024 with cash, cash equivalents and restricted cash of $230.1 million, up from $91.4 million as of Dec 31, 2023.
As of Mar 31, 2024, this retail REIT had nearly $1.50 billion of capacity under its revolving credit facility. As of the same date, its pro-rata net debt-to-operating EBITDAre was 5.4X on a trailing 12-month basis.
Dividend Update
On May 1, Regency Centers’ board of directors declared a quarterly cash dividend payment on its common stock of 67 cents. The dividend will be paid out on Jul 3, 2024, to its shareholders of record as of Jun 12, 2024.
2024 Outlook Revised
Regency Centers raised the 2024 NAREIT FFO per share guidance to the range of $4.15-$4.21 from the prior-guided range of $4.14-$4.20. The Zacks Consensus Estimate is presently pegged at $4.19, within the guided range.
The Same Property NOI (excluding termination fees or collection of 2020/2021 reserves) is expected to be between 2% and 2.5%, remaining unchanged from the previous estimation.
Regency Centers currently carries a Zacks Rank #3 (Hold). You can see the complete list of today’s Zacks #1 Rank (Strong Buy) stocks here.
Regency Centers Corporation Price, Consensus and EPS Surprise
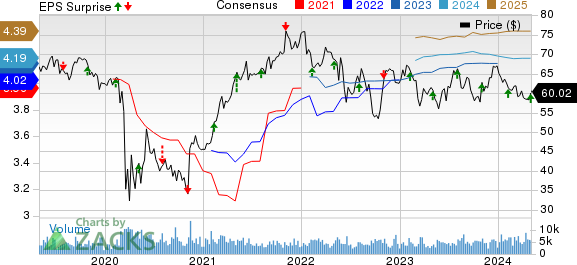
Regency Centers Corporation price-consensus-eps-surprise-chart | Regency Centers Corporation Quote
Performance of Other Retail REITs
The Macerich Company MAC reported an FFO per share, excluding financing expense in relation to Chandler Freehold, of 31 cents, which missed the Zacks Consensus Estimate of 39 cents. Moreover, the figure declined 22.5% from the year-ago quarter’s 40 cents.
The results reflected a year-over-year fall in quarterly revenues. MAC also experienced a decline in same-center net operating income, including lease termination income, from the prior-year period.
Kimco Realty Corp. KIM reported first-quarter 2024 FFO per share of 39 cents, which beat the Zacks Consensus Estimate of 38 cents. The figure was in line with the year-ago quarter’s tally.
Though KIM reported growth in revenues, a rise in interest expenses acted as a dampener.
Note: Anything related to earnings presented in this write-up represents funds from operations (FFO), a widely used metric to gauge the performance of REITs.
Want the latest recommendations from Zacks Investment Research? Today, you can download 7 Best Stocks for the Next 30 Days. Click to get this free report
Kimco Realty Corporation (KIM) : Free Stock Analysis Report
Macerich Company (The) (MAC) : Free Stock Analysis Report
Regency Centers Corporation (REG) : Free Stock Analysis Report
