
 Yahoo Finance
 Red 5 Limited's (ASX:RED) institutional investors lost 9.7% last week but have benefitted from longer-term gains
Key Insights
Institutions' substantial holdings in Red 5 implies that they have significant influence over the company's share price
A total of 9 investors have a majority stake in the company with 52% ownership
Analyst forecasts along with ownership data serve to give a strong idea about prospects for a business
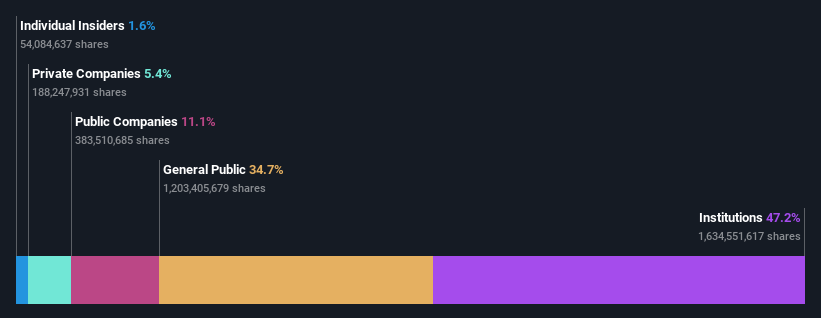
Every investor in Red 5 Limited (ASX:RED) should be aware of the most powerful shareholder groups. With 47% stake, institutions possess the maximum shares in the company. In other words, the group stands to gain the most (or lose the most) from their investment into the company.
Institutional investors was the group most impacted after the company's market cap fell to AU$970m last week. However, the 12% one-year return to shareholders may have helped lessen their pain. We would assume however, that they would be on the lookout for weakness in the future.
In the chart below, we zoom in on the different ownership groups of Red 5.
See our latest analysis for Red 5
What Does The Institutional Ownership Tell Us About Red 5?
Institutional investors commonly compare their own returns to the returns of a commonly followed index. So they generally do consider buying larger companies that are included in the relevant benchmark index.
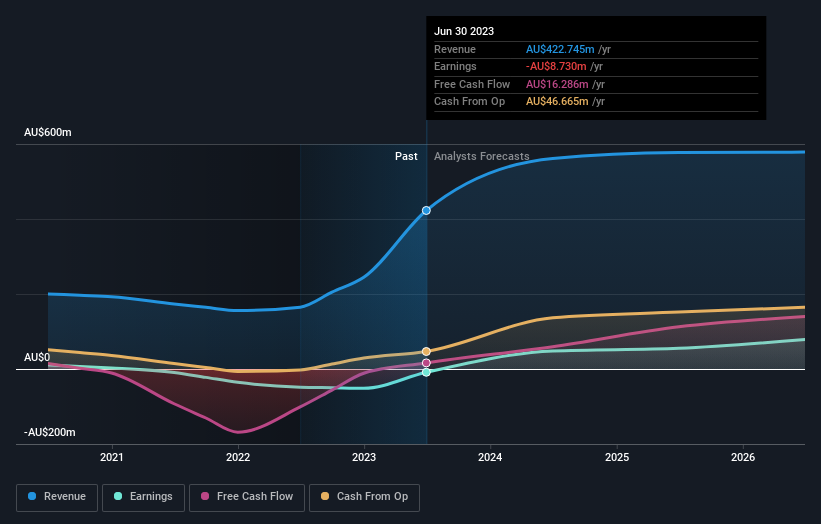
As you can see, institutional investors have a fair amount of stake in Red 5. This can indicate that the company has a certain degree of credibility in the investment community. However, it is best to be wary of relying on the supposed validation that comes with institutional investors. They too, get it wrong sometimes. When multiple institutions own a stock, there's always a risk that they are in a 'crowded trade'. When such a trade goes wrong, multiple parties may compete to sell stock fast. This risk is higher in a company without a history of growth. You can see Red 5's historic earnings and revenue below, but keep in mind there's always more to the story.
We note that hedge funds don't have a meaningful investment in Red 5. Silver Lake Resources Limited is currently the company's largest shareholder with 11% of shares outstanding. In comparison, the second and third largest shareholders hold about 9.8% and 6.4% of the stock.
We did some more digging and found that 9 of the top shareholders account for roughly 52% of the register, implying that along with larger shareholders, there are a few smaller shareholders, thereby balancing out each others interests somewhat.
While it makes sense to study institutional ownership data for a company, it also makes sense to study analyst sentiments to know which way the wind is blowing. There are a reasonable number of analysts covering the stock, so it might be useful to find out their aggregate view on the future.
Insider Ownership Of Red 5
The definition of company insiders can be subjective and does vary between jurisdictions. Our data reflects individual insiders, capturing board members at the very least. The company management answer to the board and the latter should represent the interests of shareholders. Notably, sometimes top-level managers are on the board themselves.
Insider ownership is positive when it signals leadership are thinking like the true owners of the company. However, high insider ownership can also give immense power to a small group within the company. This can be negative in some circumstances.
Shareholders would probably be interested to learn that insiders own shares in Red 5 Limited. In their own names, insiders own AU$15m worth of stock in the AU$970m company. This shows at least some alignment. You can click here to see if those insiders have been buying or selling.
General Public Ownership
With a 35% ownership, the general public, mostly comprising of individual investors, have some degree of sway over Red 5. This size of ownership, while considerable, may not be enough to change company policy if the decision is not in sync with other large shareholders.
Private Company Ownership
We can see that Private Companies own 5.4%, of the shares on issue. Private companies may be related parties. Sometimes insiders have an interest in a public company through a holding in a private company, rather than in their own capacity as an individual. While it's hard to draw any broad stroke conclusions, it is worth noting as an area for further research.
Public Company Ownership
We can see that public companies hold 11% of the Red 5 shares on issue. It's hard to say for sure but this suggests they have entwined business interests. This might be a strategic stake, so it's worth watching this space for changes in ownership.
Next Steps:
It's always worth thinking about the different groups who own shares in a company. But to understand Red 5 better, we need to consider many other factors. For example, we've discovered 1 warning sign for Red 5 that you should be aware of before investing here.
Ultimately the future is most important. You can access this free report on analyst forecasts for the company.
NB: Figures in this article are calculated using data from the last twelve months, which refer to the 12-month period ending on the last date of the month the financial statement is dated. This may not be consistent with full year annual report figures.
Have feedback on this article? Concerned about the content? Get in touch with us directly. Alternatively, email editorial-team (at) simplywallst.com.
This article by Simply Wall St is general in nature. We provide commentary based on historical data and analyst forecasts only using an unbiased methodology and our articles are not intended to be financial advice. It does not constitute a recommendation to buy or sell any stock, and does not take account of your objectives, or your financial situation. We aim to bring you long-term focused analysis driven by fundamental data. Note that our analysis may not factor in the latest price-sensitive company announcements or qualitative material. Simply Wall St has no position in any stocks mentioned.
