
 Yahoo Finance
 There Are Reasons To Feel Uneasy About United Internet's (ETR:UTDI) Returns On Capital
What trends should we look for it we want to identify stocks that can multiply in value over the long term? Firstly, we'll want to see a proven return on capital employed (ROCE) that is increasing, and secondly, an expanding base of capital employed. If you see this, it typically means it's a company with a great business model and plenty of profitable reinvestment opportunities. However, after briefly looking over the numbers, we don't think United Internet (ETR:UTDI) has the makings of a multi-bagger going forward, but let's have a look at why that may be.
What Is Return On Capital Employed (ROCE)?
For those that aren't sure what ROCE is, it measures the amount of pre-tax profits a company can generate from the capital employed in its business. Analysts use this formula to calculate it for United Internet:
Return on Capital Employed = Earnings Before Interest and Tax (EBIT) ÷ (Total Assets - Current Liabilities)
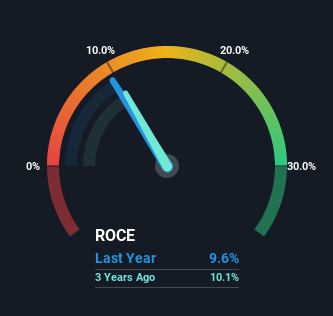
0.096 = €784m ÷ (€10b - €1.9b) (Based on the trailing twelve months to September 2022).
Therefore, United Internet has an ROCE of 9.6%. In absolute terms, that's a low return, but it's much better than the Telecom industry average of 5.2%.
View our latest analysis for United Internet
In the above chart we have measured United Internet's prior ROCE against its prior performance, but the future is arguably more important. If you'd like to see what analysts are forecasting going forward, you should check out our free report for United Internet.
What The Trend Of ROCE Can Tell Us
When we looked at the ROCE trend at United Internet, we didn't gain much confidence. Over the last five years, returns on capital have decreased to 9.6% from 17% five years ago. Meanwhile, the business is utilizing more capital but this hasn't moved the needle much in terms of sales in the past 12 months, so this could reflect longer term investments. It may take some time before the company starts to see any change in earnings from these investments.
What We Can Learn From United Internet's ROCE
Bringing it all together, while we're somewhat encouraged by United Internet's reinvestment in its own business, we're aware that returns are shrinking. And in the last five years, the stock has given away 65% so the market doesn't look too hopeful on these trends strengthening any time soon. All in all, the inherent trends aren't typical of multi-baggers, so if that's what you're after, we think you might have more luck elsewhere.
One more thing: We've identified 2 warning signs with United Internet (at least 1 which is a bit unpleasant) , and understanding them would certainly be useful.
For those who like to invest in solid companies, check out this free list of companies with solid balance sheets and high returns on equity.
Have feedback on this article? Concerned about the content? Get in touch with us directly. Alternatively, email editorial-team (at) simplywallst.com.
This article by Simply Wall St is general in nature. We provide commentary based on historical data and analyst forecasts only using an unbiased methodology and our articles are not intended to be financial advice. It does not constitute a recommendation to buy or sell any stock, and does not take account of your objectives, or your financial situation. We aim to bring you long-term focused analysis driven by fundamental data. Note that our analysis may not factor in the latest price-sensitive company announcements or qualitative material. Simply Wall St has no position in any stocks mentioned.
Join A Paid User Research Session
You’ll receive a US$30 Amazon Gift card for 1 hour of your time while helping us build better investing tools for the individual investors like yourself. Sign up here