
 Yahoo Finance
 There Are Reasons To Feel Uneasy About Martinrea International's (TSE:MRE) Returns On Capital
What trends should we look for it we want to identify stocks that can multiply in value over the long term? Typically, we'll want to notice a trend of growing return on capital employed (ROCE) and alongside that, an expanding base of capital employed. This shows us that it's a compounding machine, able to continually reinvest its earnings back into the business and generate higher returns. Although, when we looked at Martinrea International (TSE:MRE), it didn't seem to tick all of these boxes.
What Is Return On Capital Employed (ROCE)?
For those who don't know, ROCE is a measure of a company's yearly pre-tax profit (its return), relative to the capital employed in the business. To calculate this metric for Martinrea International, this is the formula:
Return on Capital Employed = Earnings Before Interest and Tax (EBIT) ÷ (Total Assets - Current Liabilities)
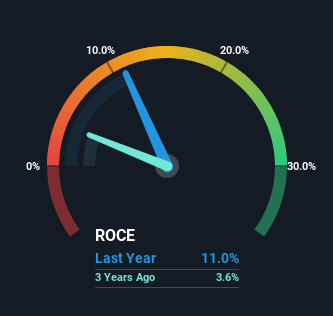
0.11 = CA$296m ÷ (CA$4.0b - CA$1.3b) (Based on the trailing twelve months to December 2023).
So, Martinrea International has an ROCE of 11%. That's a pretty standard return and it's in line with the industry average of 11%.
Check out our latest analysis for Martinrea International
In the above chart we have measured Martinrea International's prior ROCE against its prior performance, but the future is arguably more important. If you'd like, you can check out the forecasts from the analysts covering Martinrea International for free.
What The Trend Of ROCE Can Tell Us
On the surface, the trend of ROCE at Martinrea International doesn't inspire confidence. Over the last five years, returns on capital have decreased to 11% from 14% five years ago. Although, given both revenue and the amount of assets employed in the business have increased, it could suggest the company is investing in growth, and the extra capital has led to a short-term reduction in ROCE. If these investments prove successful, this can bode very well for long term stock performance.
Our Take On Martinrea International's ROCE
In summary, despite lower returns in the short term, we're encouraged to see that Martinrea International is reinvesting for growth and has higher sales as a result. And there could be an opportunity here if other metrics look good too, because the stock has declined 11% in the last five years. As a result, we'd recommend researching this stock further to uncover what other fundamentals of the business can show us.
On a final note, we've found 1 warning sign for Martinrea International that we think you should be aware of.
While Martinrea International isn't earning the highest return, check out this free list of companies that are earning high returns on equity with solid balance sheets.
Have feedback on this article? Concerned about the content? Get in touch with us directly. Alternatively, email editorial-team (at) simplywallst.com.
This article by Simply Wall St is general in nature. We provide commentary based on historical data and analyst forecasts only using an unbiased methodology and our articles are not intended to be financial advice. It does not constitute a recommendation to buy or sell any stock, and does not take account of your objectives, or your financial situation. We aim to bring you long-term focused analysis driven by fundamental data. Note that our analysis may not factor in the latest price-sensitive company announcements or qualitative material. Simply Wall St has no position in any stocks mentioned.
