
 Yahoo Finance
 Read This Before You Buy Michael Hill International Limited (ASX:MHJ) Because Of Its P/E Ratio

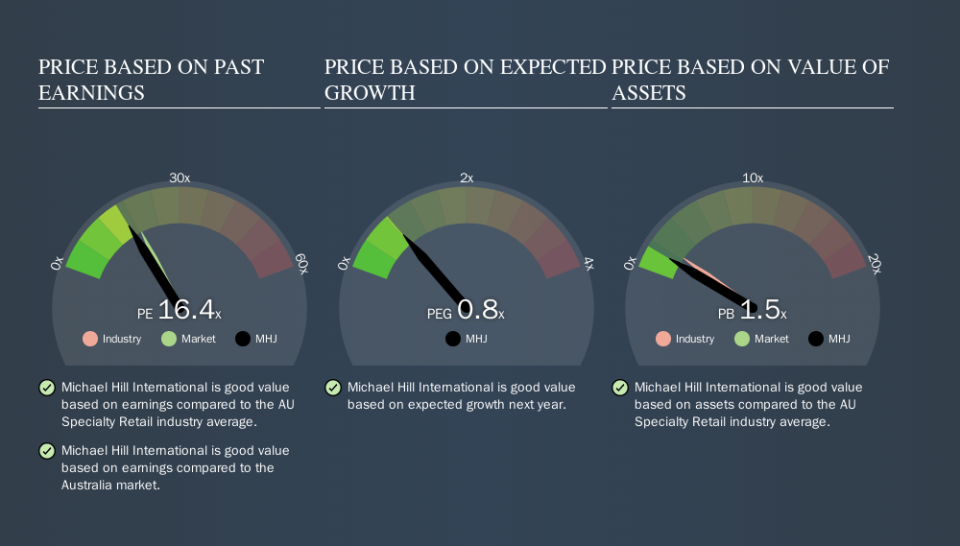
This article is written for those who want to get better at using price to earnings ratios (P/E ratios). To keep it practical, we'll show how Michael Hill International Limited's (ASX:MHJ) P/E ratio could help you assess the value on offer. Based on the last twelve months, Michael Hill International's P/E ratio is 16.44. That corresponds to an earnings yield of approximately 6.1%.
See our latest analysis for Michael Hill International
How Do I Calculate A Price To Earnings Ratio?
The formula for P/E is:
Price to Earnings Ratio = Share Price ÷ Earnings per Share (EPS)
Or for Michael Hill International:
P/E of 16.44 = A$0.70 ÷ A$0.04 (Based on the trailing twelve months to June 2019.)
Is A High Price-to-Earnings Ratio Good?
A higher P/E ratio means that buyers have to pay a higher price for each A$1 the company has earned over the last year. That is not a good or a bad thing per se, but a high P/E does imply buyers are optimistic about the future.
How Does Michael Hill International's P/E Ratio Compare To Its Peers?
One good way to get a quick read on what market participants expect of a company is to look at its P/E ratio. As you can see below Michael Hill International has a P/E ratio that is fairly close for the average for the specialty retail industry, which is 16.7.
That indicates that the market expects Michael Hill International will perform roughly in line with other companies in its industry. So if Michael Hill International actually outperforms its peers going forward, that should be a positive for the share price. Checking factors such as director buying and selling. could help you form your own view on if that will happen.
How Growth Rates Impact P/E Ratios
If earnings fall then in the future the 'E' will be lower. Therefore, even if you pay a low multiple of earnings now, that multiple will become higher in the future. So while a stock may look cheap based on past earnings, it could be expensive based on future earnings.
Michael Hill International's earnings per share fell by 48% in the last twelve months. And it has shrunk its earnings per share by 8.2% per year over the last five years. This could justify a pessimistic P/E.
Don't Forget: The P/E Does Not Account For Debt or Bank Deposits
Don't forget that the P/E ratio considers market capitalization. In other words, it does not consider any debt or cash that the company may have on the balance sheet. Theoretically, a business can improve its earnings (and produce a lower P/E in the future) by investing in growth. That means taking on debt (or spending its cash).
Such spending might be good or bad, overall, but the key point here is that you need to look at debt to understand the P/E ratio in context.
Michael Hill International's Balance Sheet
Michael Hill International has net debt worth just 9.2% of its market capitalization. It would probably trade on a higher P/E ratio if it had a lot of cash, but I doubt it is having a big impact.
The Bottom Line On Michael Hill International's P/E Ratio
Michael Hill International has a P/E of 16.4. That's below the average in the AU market, which is 18.6. The debt levels are not a major concern, but the lack of EPS growth is likely weighing on sentiment.
Investors have an opportunity when market expectations about a stock are wrong. If it is underestimating a company, investors can make money by buying and holding the shares until the market corrects itself. So this free visual report on analyst forecasts could hold the key to an excellent investment decision.
But note: Michael Hill International may not be the best stock to buy. So take a peek at this free list of interesting companies with strong recent earnings growth (and a P/E ratio below 20).
We aim to bring you long-term focused research analysis driven by fundamental data. Note that our analysis may not factor in the latest price-sensitive company announcements or qualitative material.
If you spot an error that warrants correction, please contact the editor at editorial-team@simplywallst.com. This article by Simply Wall St is general in nature. It does not constitute a recommendation to buy or sell any stock, and does not take account of your objectives, or your financial situation. Simply Wall St has no position in the stocks mentioned. Thank you for reading.
