
 Yahoo Finance
 Read This Before You Buy Cathay General Bancorp (NASDAQ:CATY) Because Of Its P/E Ratio

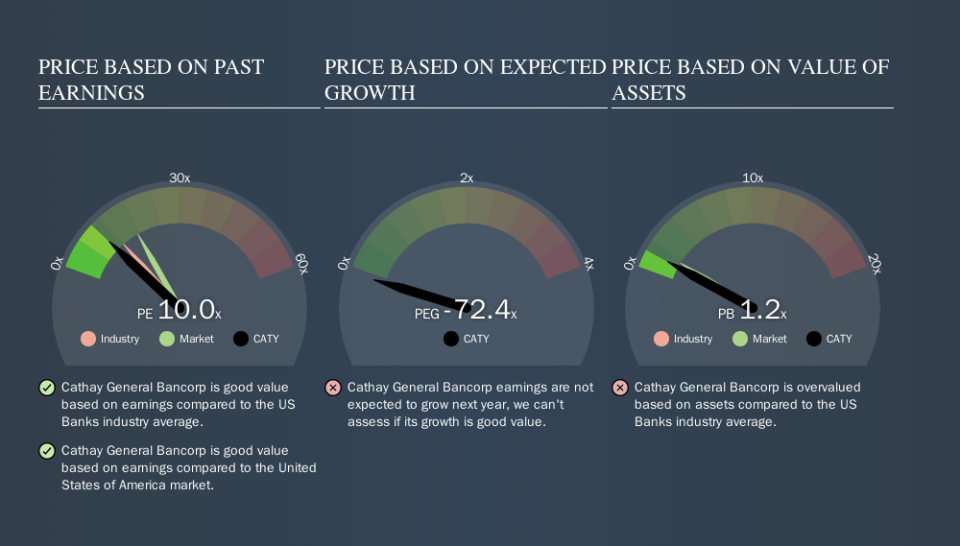
This article is for investors who would like to improve their understanding of price to earnings ratios (P/E ratios). To keep it practical, we'll show how Cathay General Bancorp's (NASDAQ:CATY) P/E ratio could help you assess the value on offer. What is Cathay General Bancorp's P/E ratio? Well, based on the last twelve months it is 10.04. That is equivalent to an earnings yield of about 10.0%.
See our latest analysis for Cathay General Bancorp
How Do I Calculate A Price To Earnings Ratio?
The formula for P/E is:
Price to Earnings Ratio = Share Price ÷ Earnings per Share (EPS)
Or for Cathay General Bancorp:
P/E of 10.04 = $34.01 ÷ $3.39 (Based on the trailing twelve months to June 2019.)
Is A High Price-to-Earnings Ratio Good?
A higher P/E ratio means that investors are paying a higher price for each $1 of company earnings. That isn't necessarily good or bad, but a high P/E implies relatively high expectations of what a company can achieve in the future.
How Does Cathay General Bancorp's P/E Ratio Compare To Its Peers?
The P/E ratio essentially measures market expectations of a company. We can see in the image below that the average P/E (12.3) for companies in the banks industry is higher than Cathay General Bancorp's P/E.
This suggests that market participants think Cathay General Bancorp will underperform other companies in its industry. Since the market seems unimpressed with Cathay General Bancorp, it's quite possible it could surprise on the upside. It is arguably worth checking if insiders are buying shares, because that might imply they believe the stock is undervalued.
How Growth Rates Impact P/E Ratios
P/E ratios primarily reflect market expectations around earnings growth rates. If earnings are growing quickly, then the 'E' in the equation will increase faster than it would otherwise. That means even if the current P/E is high, it will reduce over time if the share price stays flat. A lower P/E should indicate the stock is cheap relative to others -- and that may attract buyers.
Cathay General Bancorp increased earnings per share by a whopping 29% last year. And earnings per share have improved by 16% annually, over the last five years. So we'd generally expect it to have a relatively high P/E ratio.
Remember: P/E Ratios Don't Consider The Balance Sheet
It's important to note that the P/E ratio considers the market capitalization, not the enterprise value. Thus, the metric does not reflect cash or debt held by the company. Theoretically, a business can improve its earnings (and produce a lower P/E in the future) by investing in growth. That means taking on debt (or spending its cash).
Spending on growth might be good or bad a few years later, but the point is that the P/E ratio does not account for the option (or lack thereof).
So What Does Cathay General Bancorp's Balance Sheet Tell Us?
Cathay General Bancorp has net debt worth just 8.5% of its market capitalization. The market might award it a higher P/E ratio if it had net cash, but its unlikely this low level of net borrowing is having a big impact on the P/E multiple.
The Bottom Line On Cathay General Bancorp's P/E Ratio
Cathay General Bancorp trades on a P/E ratio of 10.0, which is below the US market average of 17.4. The EPS growth last year was strong, and debt levels are quite reasonable. The low P/E ratio suggests current market expectations are muted, implying these levels of growth will not continue.
Investors have an opportunity when market expectations about a stock are wrong. If it is underestimating a company, investors can make money by buying and holding the shares until the market corrects itself. So this free visualization of the analyst consensus on future earnings could help you make the right decision about whether to buy, sell, or hold.
Of course you might be able to find a better stock than Cathay General Bancorp. So you may wish to see this free collection of other companies that have grown earnings strongly.
We aim to bring you long-term focused research analysis driven by fundamental data. Note that our analysis may not factor in the latest price-sensitive company announcements or qualitative material.
If you spot an error that warrants correction, please contact the editor at editorial-team@simplywallst.com. This article by Simply Wall St is general in nature. It does not constitute a recommendation to buy or sell any stock, and does not take account of your objectives, or your financial situation. Simply Wall St has no position in the stocks mentioned. Thank you for reading.
