
 Yahoo Finance
 Are REA Group Limited’s (ASX:REA) Interest Costs Too High?

Small-cap and large-cap companies receive a lot of attention from investors, but mid-cap stocks like REA Group Limited (ASX:REA), with a market cap of AU$11.07b, are often out of the spotlight. Surprisingly though, when accounted for risk, mid-caps have delivered better returns compared to the two other categories of stocks. Let’s take a look at REA’s debt concentration and assess their financial liquidity to get an idea of their ability to fund strategic acquisitions and grow through cyclical pressures. Note that this information is centred entirely on financial health and is a top-level understanding, so I encourage you to look further into REA here.
Check out our latest analysis for REA Group
How does REA’s operating cash flow stack up against its debt?
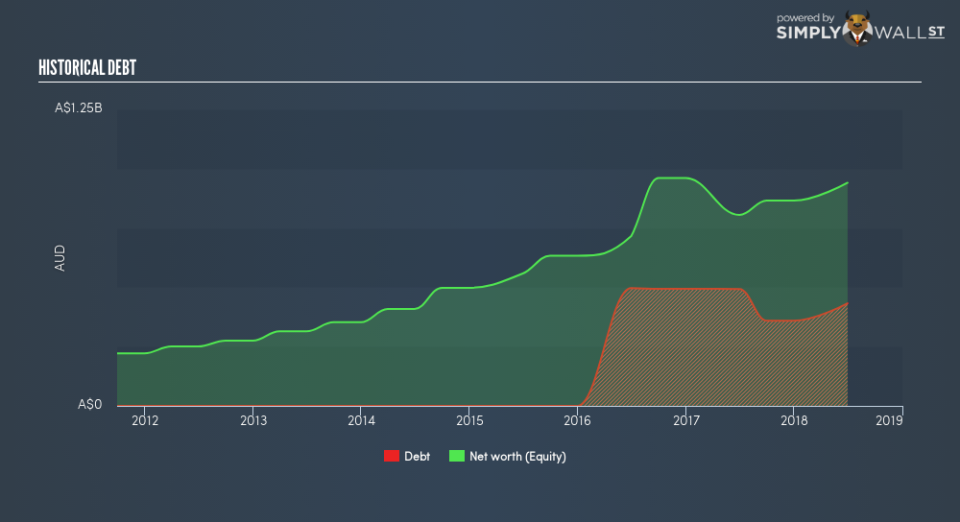
Over the past year, REA has reduced its debt from AU$492.9m to AU$432.4m , which comprises of short- and long-term debt. With this debt payback, REA’s cash and short-term investments stands at AU$115.8m , ready to deploy into the business. Additionally, REA has generated cash from operations of AU$326.3m during the same period of time, resulting in an operating cash to total debt ratio of 75.5%, meaning that REA’s operating cash is sufficient to cover its debt. This ratio can also be interpreted as a measure of efficiency as an alternative to return on assets. In REA’s case, it is able to generate 0.75x cash from its debt capital.
Can REA meet its short-term obligations with the cash in hand?
Looking at REA’s most recent AU$305.4m liabilities, the company is not able to meet these obligations given the level of current assets of AU$284.0m, with a current ratio of 0.93x below the prudent level of 3x.
Can REA service its debt comfortably?
REA is a relatively highly levered company with a debt-to-equity of 46.0%. This is not unusual for mid-caps as debt tends to be a cheaper and faster source of funding for some businesses. We can check to see whether REA is able to meet its debt obligations by looking at the net interest coverage ratio. A company generating earnings before interest and tax (EBIT) at least three times its net interest payments is considered financially sound. In REA’s, case, the ratio of 51.99x suggests that interest is comfortably covered, which means that lenders may be less hesitant to lend out more funding as REA’s high interest coverage is seen as responsible and safe practice.
Next Steps:
REA’s high cash coverage means that, although its debt levels are high, the company is able to utilise its borrowings efficiently in order to generate cash flow. However, its lack of liquidity raises questions over current asset management practices for the mid-cap. This is only a rough assessment of financial health, and I’m sure REA has company-specific issues impacting its capital structure decisions. I recommend you continue to research REA Group to get a better picture of the stock by looking at:
Future Outlook: What are well-informed industry analysts predicting for REA’s future growth? Take a look at our free research report of analyst consensus for REA’s outlook.
Valuation: What is REA worth today? Is the stock undervalued, even when its growth outlook is factored into its intrinsic value? The intrinsic value infographic in our free research report helps visualize whether REA is currently mispriced by the market.
Other High-Performing Stocks: Are there other stocks that provide better prospects with proven track records? Explore our free list of these great stocks here.
To help readers see past the short term volatility of the financial market, we aim to bring you a long-term focused research analysis purely driven by fundamental data. Note that our analysis does not factor in the latest price-sensitive company announcements.
The author is an independent contributor and at the time of publication had no position in the stocks mentioned. For errors that warrant correction please contact the editor at editorial-team@simplywallst.com.
