
 Yahoo Finance
 Queen's Road Capital Investment (TSE:QRC) Knows How To Allocate Capital Effectively
There are a few key trends to look for if we want to identify the next multi-bagger. In a perfect world, we'd like to see a company investing more capital into its business and ideally the returns earned from that capital are also increasing. Put simply, these types of businesses are compounding machines, meaning they are continually reinvesting their earnings at ever-higher rates of return. And in light of that, the trends we're seeing at Queen's Road Capital Investment's (TSE:QRC) look very promising so lets take a look.
What Is Return On Capital Employed (ROCE)?
For those who don't know, ROCE is a measure of a company's yearly pre-tax profit (its return), relative to the capital employed in the business. Analysts use this formula to calculate it for Queen's Road Capital Investment:
Return on Capital Employed = Earnings Before Interest and Tax (EBIT) ÷ (Total Assets - Current Liabilities)
0.25 = US$70m ÷ (US$304m - US$23m) (Based on the trailing twelve months to February 2024).
Thus, Queen's Road Capital Investment has an ROCE of 25%. That's a fantastic return and not only that, it outpaces the average of 1.6% earned by companies in a similar industry.
Check out our latest analysis for Queen's Road Capital Investment
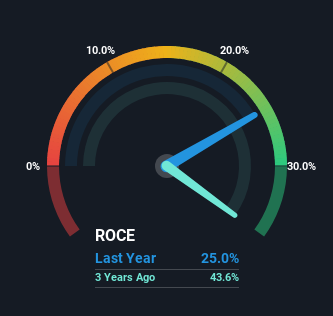
Historical performance is a great place to start when researching a stock so above you can see the gauge for Queen's Road Capital Investment's ROCE against it's prior returns. If you'd like to look at how Queen's Road Capital Investment has performed in the past in other metrics, you can view this free graph of Queen's Road Capital Investment's past earnings, revenue and cash flow.
What The Trend Of ROCE Can Tell Us
We're delighted to see that Queen's Road Capital Investment is reaping rewards from its investments and is now generating some pre-tax profits. The company was generating losses five years ago, but now it's earning 25% which is a sight for sore eyes. And unsurprisingly, like most companies trying to break into the black, Queen's Road Capital Investment is utilizing 18,098% more capital than it was five years ago. This can tell us that the company has plenty of reinvestment opportunities that are able to generate higher returns.
Our Take On Queen's Road Capital Investment's ROCE
Long story short, we're delighted to see that Queen's Road Capital Investment's reinvestment activities have paid off and the company is now profitable. And with the stock having performed exceptionally well over the last five years, these patterns are being accounted for by investors. So given the stock has proven it has promising trends, it's worth researching the company further to see if these trends are likely to persist.
Since virtually every company faces some risks, it's worth knowing what they are, and we've spotted 2 warning signs for Queen's Road Capital Investment (of which 1 makes us a bit uncomfortable!) that you should know about.
If you want to search for more stocks that have been earning high returns, check out this free list of stocks with solid balance sheets that are also earning high returns on equity.
Have feedback on this article? Concerned about the content? Get in touch with us directly. Alternatively, email editorial-team (at) simplywallst.com.
This article by Simply Wall St is general in nature. We provide commentary based on historical data and analyst forecasts only using an unbiased methodology and our articles are not intended to be financial advice. It does not constitute a recommendation to buy or sell any stock, and does not take account of your objectives, or your financial situation. We aim to bring you long-term focused analysis driven by fundamental data. Note that our analysis may not factor in the latest price-sensitive company announcements or qualitative material. Simply Wall St has no position in any stocks mentioned.
