
 Yahoo Finance
 Qube Holdings (ASX:QUB) Has Compensated Shareholders With A Respectable 41% Return On Their Investment

Want to participate in a short research study? Help shape the future of investing tools and earn a $40 gift card!
When we invest, we're generally looking for stocks that outperform the market average. Buying under-rated businesses is one path to excess returns. For example, long term Qube Holdings Limited (ASX:QUB) shareholders have enjoyed a 17% share price rise over the last half decade, well in excess of the market return of around 3.6% (not including dividends).
View our latest analysis for Qube Holdings
While the efficient markets hypothesis continues to be taught by some, it has been proven that markets are over-reactive dynamic systems, and investors are not always rational. One flawed but reasonable way to assess how sentiment around a company has changed is to compare the earnings per share (EPS) with the share price.
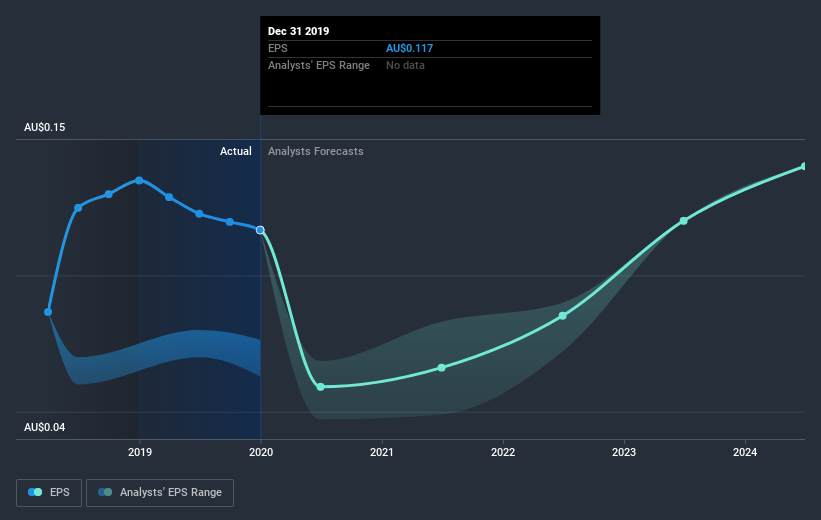
Over half a decade, Qube Holdings managed to grow its earnings per share at 3.2% a year. That makes the EPS growth particularly close to the yearly share price growth of 3.3%. Therefore one could conclude that sentiment towards the shares hasn't morphed very much. Rather, the share price has approximately tracked EPS growth.
You can see how EPS has changed over time in the image below (click on the chart to see the exact values).
It's good to see that there was some significant insider buying in the last three months. That's a positive. That said, we think earnings and revenue growth trends are even more important factors to consider. Dive deeper into the earnings by checking this interactive graph of Qube Holdings' earnings, revenue and cash flow.
What About Dividends?
When looking at investment returns, it is important to consider the difference between total shareholder return (TSR) and share price return. The TSR incorporates the value of any spin-offs or discounted capital raisings, along with any dividends, based on the assumption that the dividends are reinvested. It's fair to say that the TSR gives a more complete picture for stocks that pay a dividend. As it happens, Qube Holdings' TSR for the last 5 years was 41%, which exceeds the share price return mentioned earlier. And there's no prize for guessing that the dividend payments largely explain the divergence!
A Different Perspective
Although it hurts that Qube Holdings returned a loss of 3.1% in the last twelve months, the broader market was actually worse, returning a loss of 7.3%. Longer term investors wouldn't be so upset, since they would have made 7.1%, each year, over five years. It could be that the business is just facing some short term problems, but shareholders should keep a close eye on the fundamentals. It's always interesting to track share price performance over the longer term. But to understand Qube Holdings better, we need to consider many other factors. Even so, be aware that Qube Holdings is showing 3 warning signs in our investment analysis , and 1 of those shouldn't be ignored...
If you like to buy stocks alongside management, then you might just love this free list of companies. (Hint: insiders have been buying them).
Please note, the market returns quoted in this article reflect the market weighted average returns of stocks that currently trade on AU exchanges.
This article by Simply Wall St is general in nature. It does not constitute a recommendation to buy or sell any stock, and does not take account of your objectives, or your financial situation. We aim to bring you long-term focused analysis driven by fundamental data. Note that our analysis may not factor in the latest price-sensitive company announcements or qualitative material. Simply Wall St has no position in any stocks mentioned.
Have feedback on this article? Concerned about the content? Get in touch with us directly. Alternatively, email editorial-team@simplywallst.com.
