
 Yahoo Finance
 Prysmian SpA's Dividend Analysis
Assessing the Upcoming Dividend and Historical Performance of Prysmian SpA
Prysmian SpA (PRYMY) recently announced a dividend of $0.37 per share, payable on 2024-05-08, with the ex-dividend date set for 2024-04-24. As investors look forward to this upcoming payment, the spotlight also shines on the company's dividend history, yield, and growth rates. Using the data from GuruFocus, let's look into Prysmian SpA's dividend performance and assess its sustainability.
What Does Prysmian SpA Do?
This Powerful Chart Made Peter Lynch 29% A Year For 13 Years
How to calculate the intrinsic value of a stock?
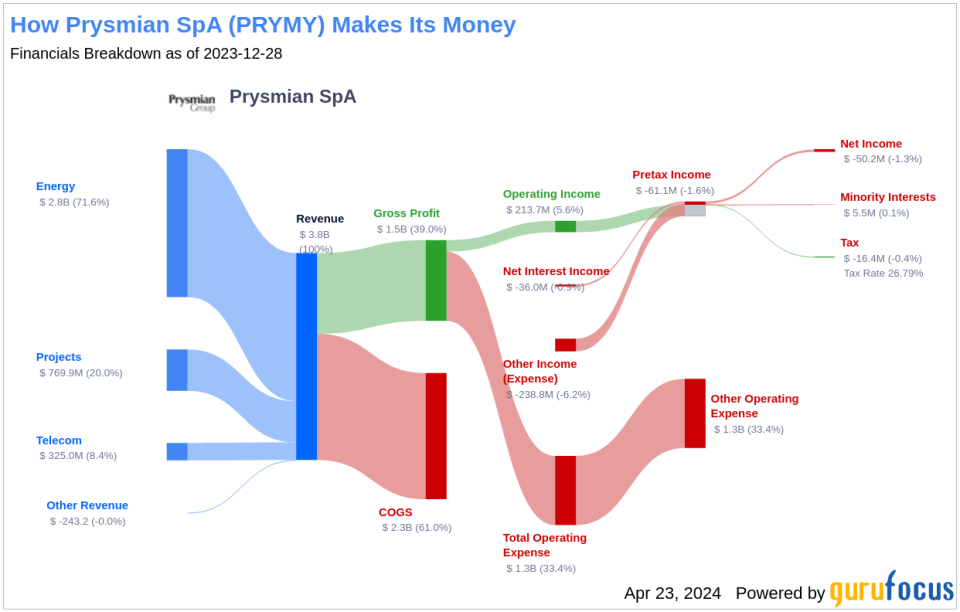
Prysmian SpA is an Italian manufacturer of electric power transmission and telecommunications cables and systems. Its business is organized in three segments--Projects, which focuses on the execution of underground and submarine cable projects; Energy Products, which provides power distribution, and industrial and network components; and Telecom, which makes cable systems and connectivity products. More than half of the firm's revenue is generated in the Europe, Middle East, and Africa regions, with the rest coming from North America, Latin America, and Asia-Pacific regions.
A Glimpse at Prysmian SpA's Dividend History
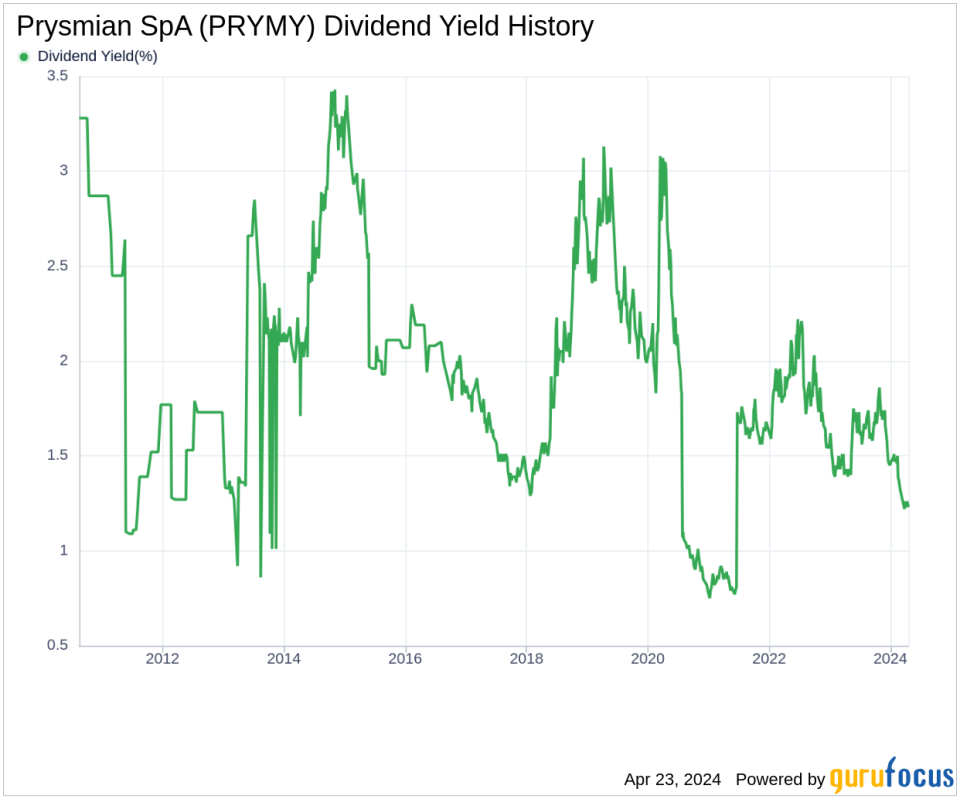
Prysmian SpA has maintained a consistent dividend payment record since 2010. Dividends are currently distributed on a yearly basis. Below is a chart showing annual Dividends Per Share for tracking historical trends.
Breaking Down Prysmian SpA's Dividend Yield and Growth
As of today, Prysmian SpA currently has a 12-month trailing dividend yield of 1.23% and a 12-month forward dividend yield of 1.39%. This suggests an expectation of increased dividend payments over the next 12 months. Over the past three years, Prysmian SpA's annual dividend growth rate was 33.90%. Extended to a five-year horizon, this rate decreased to 9.80% per year. And over the past decade, Prysmian SpA's annual dividends per share growth rate stands at 2.60%.
Based on Prysmian SpA's dividend yield and five-year growth rate, the 5-year yield on cost of Prysmian SpA stock as of today is approximately 1.96%.
The Sustainability Question: Payout Ratio and Profitability
To assess the sustainability of the dividend, one needs to evaluate the company's payout ratio. The dividend payout ratio provides insights into the portion of earnings the company distributes as dividends. A lower ratio suggests that the company retains a significant part of its earnings, thereby ensuring the availability of funds for future growth and unexpected downturns. As of 2023-12-31, Prysmian SpA's dividend payout ratio is 0.25.
Prysmian SpA's profitability rank, offers an understanding of the company's earnings prowess relative to its peers. GuruFocus ranks Prysmian SpA's profitability 7 out of 10 as of 2023-12-31, suggesting good profitability prospects. The company has reported positive net income for each of year over the past decade, further solidifying its high profitability.
Growth Metrics: The Future Outlook
To ensure the sustainability of dividends, a company must have robust growth metrics. Prysmian SpA's growth rank of 7 out of 10 suggests that the company's growth trajectory is good relative to its competitors.
Revenue is the lifeblood of any company, and Prysmian SpA's revenue per share, combined with the 3-year revenue growth rate, indicates a strong revenue model. Prysmian SpA's revenue has increased by approximately 11.50% per year on average, a rate that outperforms approximately 61.05% of global competitors.
The company's 3-year EPS growth rate showcases its capability to grow its earnings, a critical component for sustaining dividends in the long run. During the past three years, Prysmian SpA's earnings increased by approximately 34.70% per year on average, a rate that outperforms approximately 76.44% of global competitors.
Lastly, the company's 5-year EBITDA growth rate of 28.50%, which outperforms approximately 83.09% of global competitors.
Next Steps
With a solid dividend track record, promising growth rates, and a reasonable payout ratio, Prysmian SpA appears to be a compelling choice for value investors focused on steady income streams. Its profitability and growth metrics further enhance the attractiveness of its dividend profile, positioning the company well for future dividend sustainability. Investors may wish to consider Prysmian SpA's upcoming dividend, its historical growth, and the financial health indicated by its payout ratio and profitability when making investment decisions. Can the company maintain this balance and continue to reward shareholders amidst market fluctuations? That remains a key question for investors eyeing Prysmian SpA's dividend prospects.
GuruFocus Premium users can screen for high-dividend yield stocks using the High Dividend Yield Screener.
This article, generated by GuruFocus, is designed to provide general insights and is not tailored financial advice. Our commentary is rooted in historical data and analyst projections, utilizing an impartial methodology, and is not intended to serve as specific investment guidance. It does not formulate a recommendation to purchase or divest any stock and does not consider individual investment objectives or financial circumstances. Our objective is to deliver long-term, fundamental data-driven analysis. Be aware that our analysis might not incorporate the most recent, price-sensitive company announcements or qualitative information. GuruFocus holds no position in the stocks mentioned herein.
This article first appeared on GuruFocus.
