
 Yahoo Finance
 Proximus SA's Dividend Analysis
Understanding the Upcoming Dividend and Historical Performance
Proximus SA (BGAOY) recently announced a dividend of $0.15 per share, payable on 2024-05-13, with the ex-dividend date set for 2024-04-24. As investors look forward to this upcoming payment, the spotlight also shines on the company's dividend history, yield, and growth rates. Using the data from GuruFocus, let's look into Proximus SA's dividend performance and assess its sustainability.
What Does Proximus SA Do?
This Powerful Chart Made Peter Lynch 29% A Year For 13 Years
How to calculate the intrinsic value of a stock?
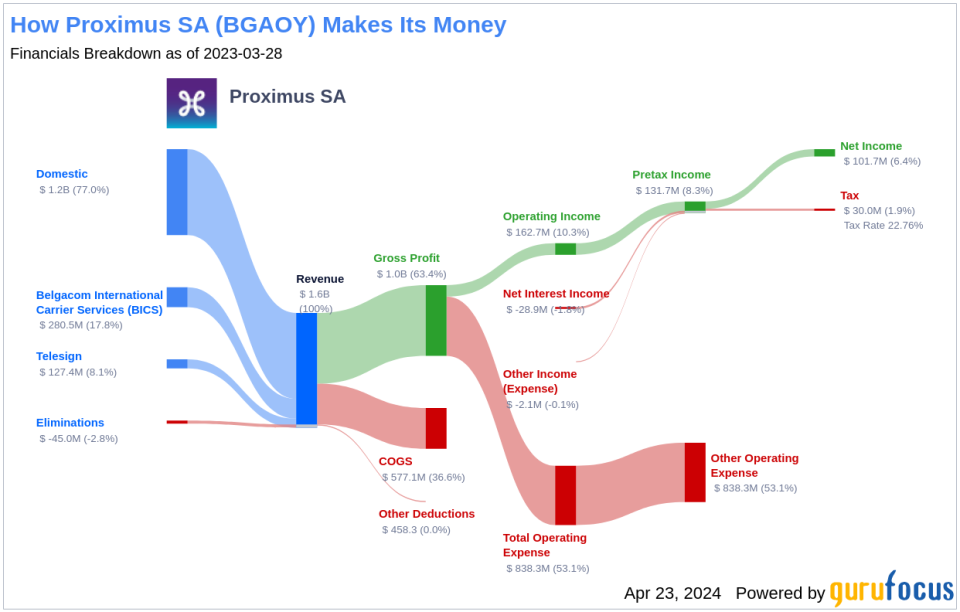
Proximus is the incumbent telecom operator in Belgium. The firm has around 45% share of the broadband market and 30% of the postpaid mobile market, mainly competing with Telenet (mobile and fixed) and Orange (mobile and fixed). Proximus is rolling out fiber to the home in Belgium and expects to have 95% of the country covered by 2032. Its international carrier services division, BICS, is one of the four largest in the world, serving more than 250 operators, which was strengthened in 2017 with the acquisition of Telesign.
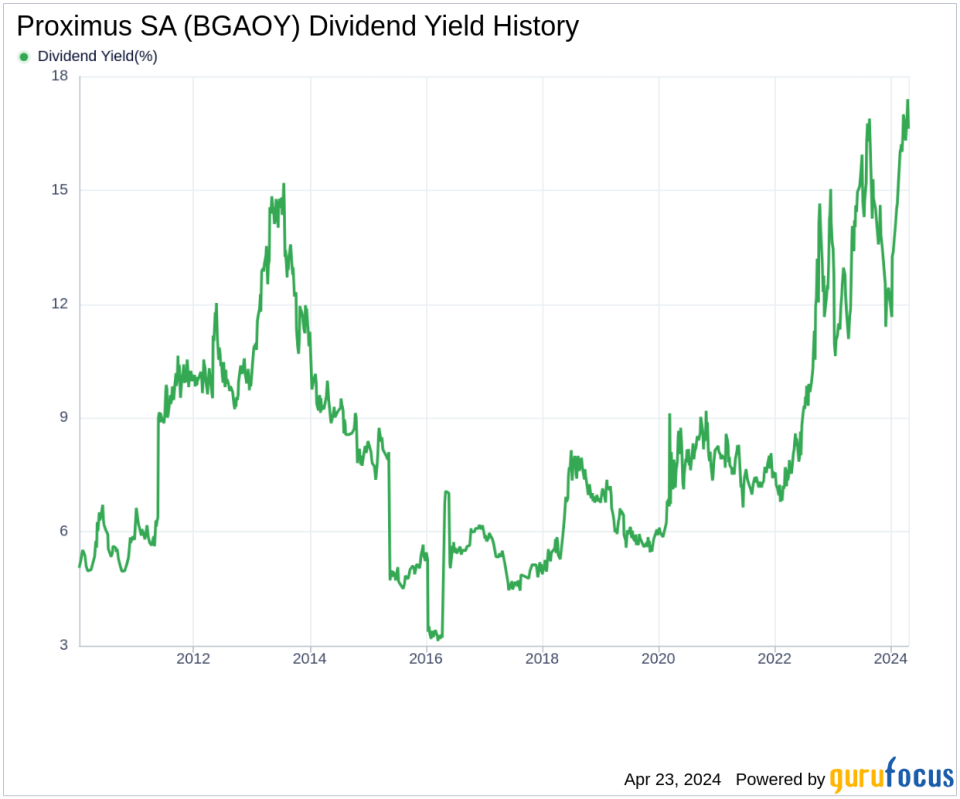
A Glimpse at Proximus SA's Dividend History
Proximus SA has maintained a consistent dividend payment record since 2009. Dividends are currently distributed on a bi-annually basis. Below is a chart showing annual Dividends Per Share for tracking historical trends.
Breaking Down Proximus SA's Dividend Yield and Growth
As of today, Proximus SA currently has a 12-month trailing dividend yield of 16.64% and a 12-month forward dividend yield of 16.34%. This suggests an expectation of decreased dividend payments over the next 12 months. Over the past three years, Proximus SA's annual dividend growth rate was -7.20%. Extended to a five-year horizon, this rate increased to -5.60% per year. And over the past decade, Proximus SA's annual dividends per share growth rate stands at -5.30%.
Based on Proximus SA's dividend yield and five-year growth rate, the 5-year yield on cost of Proximus SA stock as of today is approximately 12.47%.
The Sustainability Question: Payout Ratio and Profitability
To assess the sustainability of the dividend, one needs to evaluate the company's payout ratio. The dividend payout ratio provides insights into the portion of earnings the company distributes as dividends. A lower ratio suggests that the company retains a significant part of its earnings, thereby ensuring the availability of funds for future growth and unexpected downturns. As of 2023-12-31, Proximus SA's dividend payout ratio is 1.08, which may suggest that the company's dividend may not be sustainable.
Proximus SA's profitability rank, offers an understanding of the company's earnings prowess relative to its peers. GuruFocus ranks Proximus SA's profitability 7 out of 10 as of 2023-12-31, suggesting good profitability prospects. The company has reported positive net income for each year over the past decade, further solidifying its high profitability.
Growth Metrics: The Future Outlook
To ensure the sustainability of dividends, a company must have robust growth metrics. Proximus SA's growth rank of 7 out of 10 suggests that the company's growth trajectory is good relative to its competitors. Revenue is the lifeblood of any company, and Proximus SA's revenue per share, combined with the 3-year revenue growth rate, indicates a strong revenue model. Proximus SA's revenue has increased by approximately 3.30% per year on average, a rate that underperforms approximately 54.35% of global competitors.
The company's 3-year EPS growth rate showcases its capability to grow its earnings, a critical component for sustaining dividends in the long run. During the past three years, Proximus SA's earnings increased by approximately -13.60% per year on average, a rate that underperforms approximately 77.78% of global competitors. Lastly, the company's 5-year EBITDA growth rate of -3.50%, which underperforms approximately 77.83% of global competitors.
Next Steps
With Proximus SA's dividend payments, dividend growth rate, payout ratio, profitability, and growth metrics in view, investors should weigh the high yield against the potential risks of sustainability. The company's dividend history and current profitability rank suggest a solid track record, but the negative growth rates in dividends and earnings could be a concern. It's essential for investors to consider whether Proximus SA can overcome its growth challenges and maintain its dividend payouts in the long term. GuruFocus Premium users can screen for high-dividend yield stocks using the High Dividend Yield Screener.
This article, generated by GuruFocus, is designed to provide general insights and is not tailored financial advice. Our commentary is rooted in historical data and analyst projections, utilizing an impartial methodology, and is not intended to serve as specific investment guidance. It does not formulate a recommendation to purchase or divest any stock and does not consider individual investment objectives or financial circumstances. Our objective is to deliver long-term, fundamental data-driven analysis. Be aware that our analysis might not incorporate the most recent, price-sensitive company announcements or qualitative information. GuruFocus holds no position in the stocks mentioned herein.
This article first appeared on GuruFocus.
