
 Yahoo Finance
 Prospa Group Limited (ASX:PGL) About To Shift From Loss To Profit
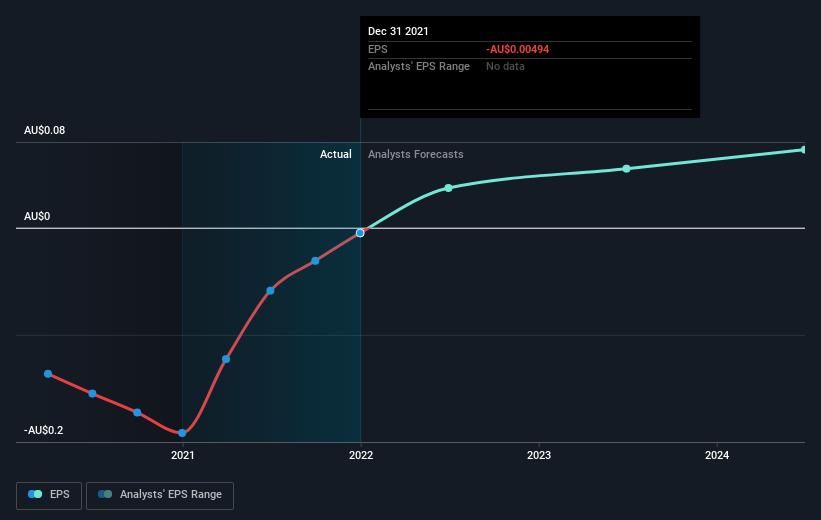
Prospa Group Limited (ASX:PGL) is possibly approaching a major achievement in its business, so we would like to shine some light on the company. Prospa Group Limited, a financial technology company, operates as an online lender in Australia. The AU$139m market-cap company posted a loss in its most recent financial year of AU$9.5m and a latest trailing-twelve-month loss of AU$856k shrinking the gap between loss and breakeven. Many investors are wondering about the rate at which Prospa Group will turn a profit, with the big question being “when will the company breakeven?” We've put together a brief outline of industry analyst expectations for the company, its year of breakeven and its implied growth rate.
View our latest analysis for Prospa Group
Consensus from 2 of the Australian Consumer Finance analysts is that Prospa Group is on the verge of breakeven. They anticipate the company to incur a final loss in 2021, before generating positive profits of AU$6.1m in 2022. Therefore, the company is expected to breakeven roughly a year from now or less! At what rate will the company have to grow in order to realise the consensus estimates forecasting breakeven in under 12 months? Using a line of best fit, we calculated an average annual growth rate of 66%, which is extremely buoyant. If this rate turns out to be too aggressive, the company may become profitable much later than analysts predict.
Underlying developments driving Prospa Group's growth isn’t the focus of this broad overview, though, keep in mind that generally a high growth rate is not out of the ordinary, particularly when a company is in a period of investment.
One thing we would like to bring into light with Prospa Group is its debt-to-equity ratio of over 2x. Generally, the rule of thumb is debt shouldn’t exceed 40% of your equity, and the company has considerably exceeded this. Note that a higher debt obligation increases the risk around investing in the loss-making company.
Next Steps:
This article is not intended to be a comprehensive analysis on Prospa Group, so if you are interested in understanding the company at a deeper level, take a look at Prospa Group's company page on Simply Wall St. We've also compiled a list of pertinent factors you should further examine:
Historical Track Record: What has Prospa Group's performance been like over the past? Go into more detail in the past track record analysis and take a look at the free visual representations of our analysis for more clarity.
Management Team: An experienced management team on the helm increases our confidence in the business – take a look at who sits on Prospa Group's board and the CEO’s background.
Other High-Performing Stocks: Are there other stocks that provide better prospects with proven track records? Explore our free list of these great stocks here.
Have feedback on this article? Concerned about the content? Get in touch with us directly. Alternatively, email editorial-team (at) simplywallst.com.
This article by Simply Wall St is general in nature. We provide commentary based on historical data and analyst forecasts only using an unbiased methodology and our articles are not intended to be financial advice. It does not constitute a recommendation to buy or sell any stock, and does not take account of your objectives, or your financial situation. We aim to bring you long-term focused analysis driven by fundamental data. Note that our analysis may not factor in the latest price-sensitive company announcements or qualitative material. Simply Wall St has no position in any stocks mentioned.
